The Resources within this shop are all designed for the teaching of Mathematics for those in the age range 7 - 18 years old. Most resources consist of a PowerPoint lesson followed by a worksheet for the students.
With over twenty nine years of experience, the powerpoint/worksheets within the shop have been used successfully by myself and colleagues over that time. As a head of department for over 15 years, the department has yearly been judged as adding substantial value to students grades.
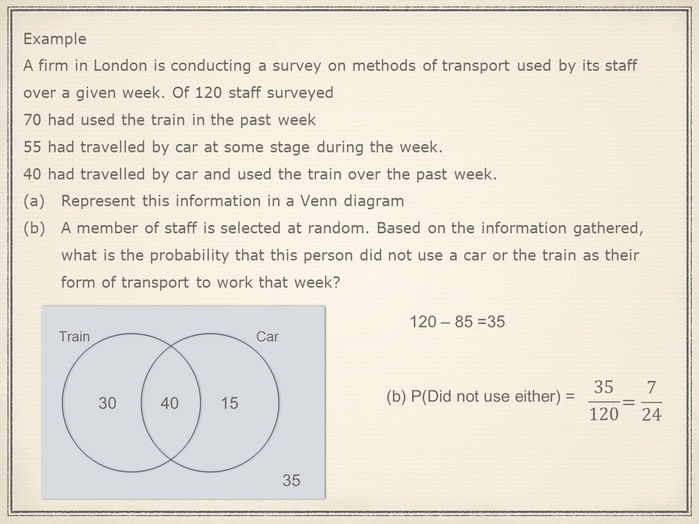
This lesson is demonstrates through worked examples how Venn diagrams can be used to obtain the probability of a given event.
The lesson also has a worksheet attached.
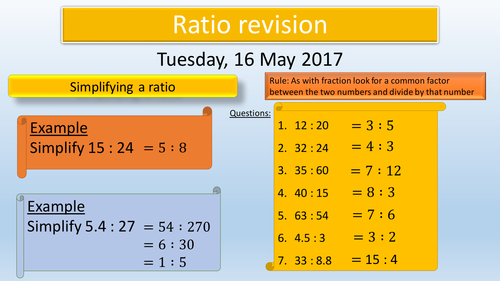
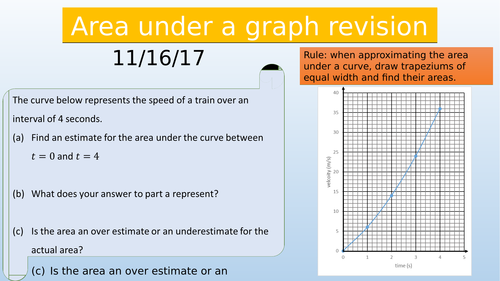
Here are two revision lessons I have used throughout the year with foundation students.
The lessons consist of worked examples followed by questions for the students to answer.
The PowerPoint is broken down so that any foundation student can access the material.
Introduces students to the designated button on the calculator for Standard form questions.
After a series of examples there is a worksheet which can be printed for students to answer in class or as a piece of homework.
This lesson teaches students how to add two fractions together.
The lesson is structured for those who may struggle with adding fractions together.
The lesson is accompanied with several worksheets for students to complete on adding fractions.
Answers are included.
These two lessons and two worksheets I have used to introduce the basic knowledge of a histogram and then use this knowledge to draw a frequency polygon.
The histogram powerpoint and worksheet leaves the class widths at equal intervals.
The frequency polygon powerpoint is then taught the next lesson to show students that it is quicker to draw a frequency polygon (and use it for comparisons) rather than a histogram.
The worksheets can be used in class or given as a piece of homework.
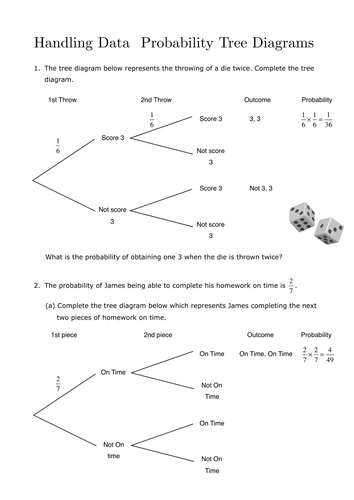
This worksheet can be used by students who have just been taught how to draw and complete a Probability tree diagram. I have a PowerPoint containing worked examples, which I use with this worksheet. This PowerPoint is available to purchase. On completing the PowerPoint students can then demonstrate their new skills with this worksheet.
The answers to this worksheet are included with the said PowerPoint. follow the link below
https://www.tes.com/teaching-resource/probability-tree-diagrams-11225929
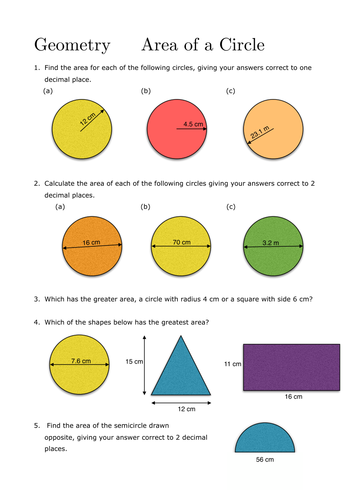
This worksheet can be used by students who have just been taught how to find the area of a circle. I have a PowerPoint which I use over two lessons which firstly encourages them to find the formula for the area of a circle. Then collectively we write down a better formula with some verbal history thrown in, before attempting some examples at the board. This PowerPoint is available to purchase. On completing the PowerPoint students can then demonstrate their new skills with this worksheet.
The answers to this worksheet are included with the PowerPoint.
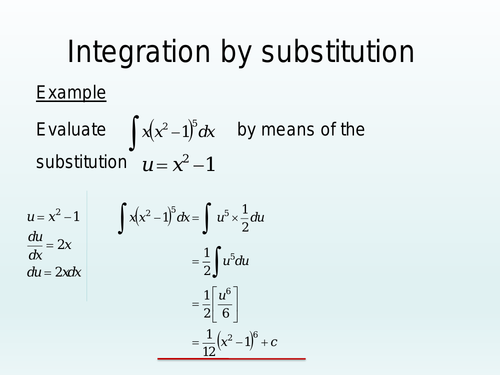
This PowerPoint contains what I teach as two lessons. The first introduces students to the method of substitution whilst the second concludes this knowledge with worked examples with the definite integral.
This revision is pitched mainly at foundation students, however it is also ideal for higher level students.
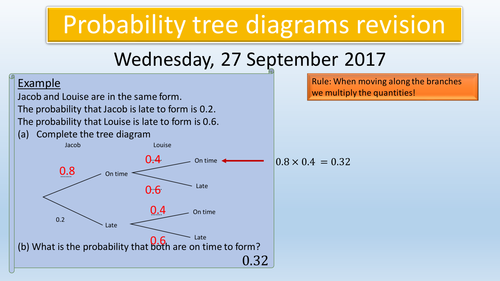
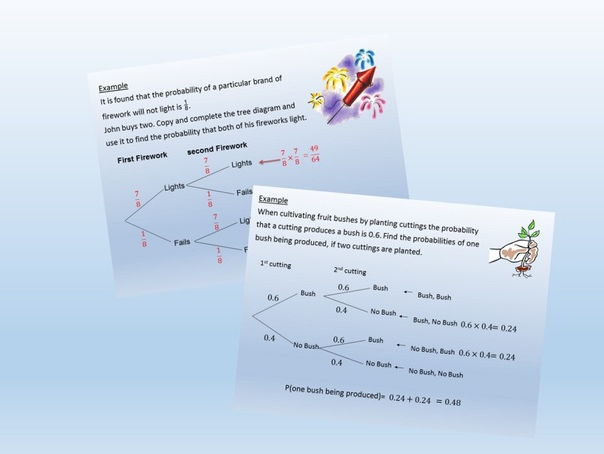
Through worked examples the students revise the fact of multiplying "branches" together in order to obtain an outcome for two event.
Further examples look at when there are more than two possible outcomes which would imply we add the solutions together.
Nicely broken up for a student who is probably struggling with the grade 5 work. There are also several questions for the students to attempt in-between the examples. Answers are provided.
This PowerPoint presentation is used to introduce students how to construct and use a Tree diagram. Through a series of worked examples students learn how to answer a variety of probability questions by using a tree diagram.
The Answers provided with this purchase are for the free worksheet provided in my shop.
These revision cards are designed for both higher level and foundation level for KS4 GCSE mathematics grades 9 to 1.
Each card has a topic explanation and a QR code which takes the students to a video related to that topic.
Ideal for any student revising for Mathematics at home or in the classroom.
Personally I have each slide printed and on the wall as a group of four. additionally I have printed them out and cut them into individual cards placed in an envelope for students to use at home whilst revising.
These two lessons teach students how to
1. Bisect a line
2. Bisect an Angle
3. Drop a perpendicular to a line
4. construct a 60 degree angle
5. construct a 90 degree angle
6. construct the 30 and 45 degree angle
7. construct 75 and 120 degree angles.
The lessons also include worksheets for the students to attempt in class or as a piece of homework.
Answers are included.
This activity is aimed at Foundation students who are revising for their GCSE examination.
Each round consists of four questions. Print the slides 8 to 13 on A4 paper and place one printed slide per table.
Students are put into pairs (either by choice or teacher selection) and are given a copy of slide 14 and a few sheets of pieces of A4 paper.
The pairs are designated a starting table and the timer (slide 2) is started. The students are then given 5 minutes to answer the four questions on that table. Once the five minutes is up the students move clockwise to the next table and start the next set of four questions and the timer of slide 3 is started. This continues until all students have completed the six tables worth of questions.
The answering of the questions takes no more than 30 minutes. Students then remain at their final table, swap their answer sheet with the nearest table and the answers are produced. At this stage I go through the questions before revealing the answers. In this way the students have had a go at GCSE style foundation questions and have also seen a demonstration as to how they should have been answered.
Finally, students add up their score and the highest score get a prize!
These resources can be used for revision with year 10 or year 11 students whilst at the same time being fun!
Likewise the foundation set can be used with students in year 9 and possibly year 8 towards the end of year.
Each game consists of 24 questions. Each table has a theme, such as Handling Data or Percentages or trigonometry, etc…
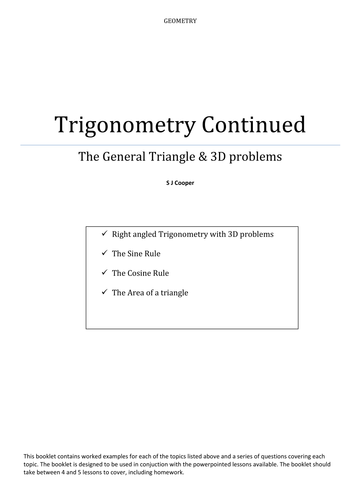
These lessons included in this resource revise Pythagoras Theorem, the knowledge of Right Angled Trigonometry, the knowledge of the sine rule cosine rule and 3D trigonometry. Accompanied with the lessons are worksheets for students to attempt in class or as homework.
Plenty of revision for all types of students Foundation or Higher Tier.
Power point lesson with worked examples demonstrates to students how we add/subtract matrices. How to multiply matrices together and then several questions for the students to answer.
The lesson is aimed at those students covering the Further Maths GCSE
This serious of revision slides has been produced for my students revising for their recent assessments. It can be used with Key stage 2 students, Key stage 3 students and Key stage 4 students studying Foundation at GCSE.
The topics covered are
Percentages with and without a calculator
Fractions with and without a calculator
Ratio cancelling down
Dividing into a given ratio
Algebraic expressions and simplifying
Solving simple equations
Angles properties.
Probability of a single event
Area of a rectangle, triangle & Trapezium
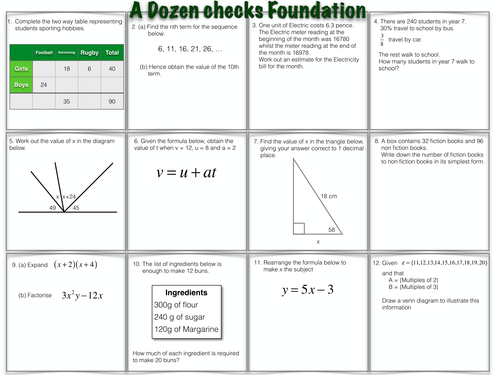
This worksheet can be used as a lesson check or piece of homework. It is designed so that the student or teacher can identify from the twelve topics which they CAN do and which topics need further work.