 Quick View
Using R to draw the equation of a straight line graph - Part 2
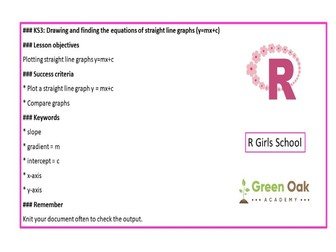
<p>This lesson follows on from ‘Using R to draw the equation of a straight line graph - Part 1’ and demonstrates how to use R to plot straight line graphs (y=mx+c) with different intercepts and negative gradients followed by questions on the observed differences.</p>
<p>There are then plenty of activities to practice using the code.</p>
<p>The maths is KS3 level.</p>
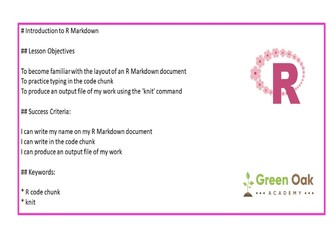
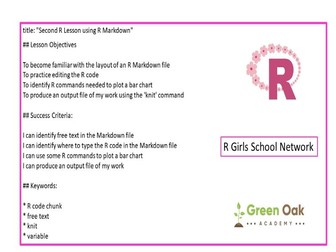
<p>This lesson assumes some knowledge of working in an R Markdown file which can be gained by working through the ‘My First Introductory R Lesson using R Markdown’ and ‘My Second Introductory R Lesson using R Markdown’ both available on TES.</p>
<p>No previous knowledge of R coding language is needed.</p>
<p>The contents of the word file needs to be copied into an R Markdown file before use.</p>
<p>This lesson assumes that you have installed RStudio or have access to RStudioCloud.</p>
<p>If you have any queries or feedback please get back to us <a href="mailto:rgirlsschool@gmail.com" target="_blank" rel="nofollow">rgirlsschool@gmail.com</a></p>