To learn how to insert bar charts<br />
To develop an understanding of the IF Functions formula.<br />
present information in different graphs i.e. bar graph, bar chart <br />
<p>I have fully completed and gone over the Digital Information Technology COMPONENT 2: Collecting, Presenting and Interpreting Data Pearson Set Assignment January 2025.</p>
<p>This is a great guide to help you complete the new released January 2025 paper.</p>
<p>Great tool to assist the marking process so you can check and cross reference against the provided answers.</p>
<p>Included is a fully completed Excel Spreadsheet with all completed tasks for 2A 2B and 2C as well as a complete ‘how to guide’ on PowerPoint.<br />
Fully completed examplar answers for 3 errors patterns and trends, as well as a guide on responding well to task 1, task 1 is generic and can be used on any PSA, not just the JAN2025.</p>
<p>Added a tracker for the entire DIT course that covers COMP1, COMP2 and COMP3 and can be used for your entire class.</p>
<p>Marking grids (updated) for answers 2A, 2B and 2C<br />
A completed marking grid to show you the best practice.</p>
This is the complete module on the topic of organization of data in statistics and economics. It is an exclusive resource where the topics are arranged in a very informative and interesting manner. All the topics are supported by examples and animations. The animated presentation will help you to understand the concept in a very simple and easy way. Each concept is explained with the help of illustrations, images, and outstanding animations. All the concepts are self-explanatory and narrative. This resource will be an added help for your studies nd exam preparations. The presentation is equally important to the students who are studying accountancy and the teachers who instruct the subject. <br />
<br />
Total Slides : 47. It's not just a ppt. It's a Complete interactive module with animation and background sound. This will give you an ultimate learning experience for sure.<br />
Contents:<br />
Collection of data<br />
Classification of data<br />
Basis of classification<br />
Variables<br />
Raw data<br />
Statistical Series<br />
Individual series<br />
Continuous series<br />
Frequency Distribution<br />
Types of frequency distribution<br />
Glossary _ Class limits, Frequency, Tally marks, Magnitude etc...
<p>Topical Past Papers are an essential tool for any student looking to succeed in their exams. These questions are regular past paper questions, but instead of covering all topics, they focus on a specific topic or theme. This allows students to test their knowledge in a more targeted way and identify any areas they may need to improve on. By practicing with Topical Past Papers, students have the opportunity to enhance their understanding of a subject and build their confidence ahead of the exam.</p>
<p>Within KS3 Computer Science: Data Representation - Year 8, your students will recall and build upon understanding developed within Data Representation for Year 7 and learn the following:</p>
<ul>
<li>To recall binary and denary conversion techniques from year 7.</li>
<li>To be able to add two binary numbers using binary addition and understand the term overflow error.</li>
<li>Understand the use and purpose of ASCII and Unicode character sets.</li>
<li>Understand how images are stored on a computer.</li>
</ul>
<ul>
<li>Understand the relationship between resolution, colour depth and file size.</li>
</ul>
<ul>
<li>Recap the terms ‘Base 2’ and ‘Base 10’ number systems.</li>
</ul>
<ul>
<li>To apply understanding to the use of Hexadecimal (base 16).</li>
</ul>
<p>Your students will learn these concepts through a range of clearly presented explanations and a range of tasks and challenges to consolidate learning.</p>
<p>This unit of work also includes a final assessment.</p>
<p><strong>Full teacher solutions also included!</strong></p>
<p>Before completing this unit of work, it is recommended that your students complete <a href="https://www.tes.com/teaching-resource/ks3-computer-science-data-representation-year-7-12102476">Data Representation for Year 7</a> and <a href="https://www.tes.com/teaching-resource/ks3-computer-science-computer-systems-year-8-11963491">Computer Systems for Year 8</a> so they have an understanding of the different hardware components of a computer.</p>
This unit of work covers organising and summarising data. It explains step by step how to do the exercises. <br />
It includes:<br />
- Revision of mode, mean, median and range.<br />
- Frequency tables<br />
- Stem and leaf diagrams<br />
- Finding the mean of an ungrouped frequency distribution<br />
- Finding the mean of a grouped frequency distribution<br />
- The median<br />
- Exercises<br />
- Answers<br />
<br />
Please, rate this resource so I can improve as I go on!
<p>These clear, detailed and visually-appealing resources offer a complete reference point for subject leaders, teachers, parents and children covering knowledge relating to ‘Data and Information’ throughout the primary computing curriculum.</p>
<p>Included are organisers for years 1-6, each with a particular focus that builds on prior knowledge:</p>
<p>-Year 1: Grouping Data<br />
-Year 2: Pictograms<br />
-Year 3: Branching Databases<br />
-Year 4: Data Logging<br />
-Year 5: Flat-File Databases<br />
-Year 6: Spreadsheets</p>
<p>The content is fully aligned with the age-related expectations for primary children in computing. The resources are designed to be printed onto A3, and are provided as both PDF and Word versions (so that you can edit if you want to).</p>
<p>This is a mini research unit that will be taught ahead of the units (after the introduction unit). It should take approximately 11 lessons to go through the basic research methods. I am aware this is no longer necessary to be taught as an explicit unit, however we feel they need the basic knowledge to be able to answer the questions in the different units. The homework task refers to a knowledge organiser than can be bought in my store. However, the homework task can be completed without it. It’s just our departmental push on the use of them throughout the unit.</p>
<p>Lesson 3- Looking at Primary, Secondary, Qual & Quan data. Considering how studies are peer reviewed and evaluated. Exam practice with model answer. Homework Task also prepared.</p>
<p>Data + Information Is generated, collected, shared | Online Safety . A fully-resourced editable PSHE PowerPoint lesson (1 hour +) which can be used by teachers to deliver a detailed workshop / session /lesson on the importance of this topic.</p>
<p>This is a topic that comes up under the new PSHE Statutory Guidance for RSHE.</p>
<p><strong>Learning Outcomes:</strong><br />
To be able to describe what is meant by collecting and sharing data To be aware of the types of data you might give to apps and websites and what they might do with this To understand the risks of companies holding your data</p>
<p><strong>Key terms</strong><br />
Data, targeted ads, algorithm, GDPR, elections, echo chamber, data breach, rights</p>
<p><strong>Each Lesson Pack Contains:</strong><br />
1 Fully Editable Careers PowerPoint (Learning Outcomes, Confidence Checkers, Assessment of Learning, Variety of Tasks, Video Embedded URL Clips, Engaging Premium Quality Slides, Extra Support Websites, Challenging & Thoughtful Questioning)<br />
Assessment Opportunity (Confidence Checker)</p>
<p>The lesson includes a detailed PowerPoint, variety of student facing tasks and comprehension tasks These resources have been designed to be engaging, informative and pick up and teach.</p>
<p><strong>Why not check out some of our latest super bundles below:</strong><br />
<a href="https://www.tes.com/teaching-resource/resource-13045587">Young Adults and Choices</a><br />
<a href="https://www.tes.com/teaching-resource/resource-12767785">Online Safety + Staying Safe</a><br />
<a href="https://www.tes.com/teaching-resource/resource-13045569">Personal Safety Unit </a><br />
<a href="https://www.tes.com/teaching-resource/resource-13045301">Equality & Protected Characteristics </a><br />
<a href="https://www.tes.com/teaching-resource/resource-12767791">British Values Explored Bundle</a><br />
<a href="https://www.tes.com/teaching-resource/resource-12767794">Society, Body Image + Peer Pressure </a><br />
<a href="https://www.tes.com/teaching-resource/resource-12994144">Diversity & Equality </a></p>
<p>If you need any support with this lesson or would like to find out more about the FULL PSHE Currriculum email: <a href="mailto:thecre8tiveresources@gmail.com" target="_blank" rel="nofollow">thecre8tiveresources@gmail.com</a> or google “Cre8tive resources”</p>
This is the first set of knowledge organisers (revision summaries) for Statistics - it can be used for any year group but is mainly for KS2, KS3 or Foundation KS4. This set consists of 4 separate pages of A4 notes, but it also works well if you print all 4 pages as an A5 booklet. I will be making more in the future, so please visit again if you like them.
<p>PowerPoint Presentation on Questionnaires and Surveys (30 slides): Explains the dos and don’ts when designing questionnaires or surveys, reviews grouping data, explains random response techniques and what to do with unexpected responses. It has been written by a highly experienced teacher (of 25+ years), senior examiner and reviser for Maths and Stats examinations. It includes:</p>
<p>Lesson objectives<br />
Step-by-step explanations of the subject matter<br />
Examples to aid understanding<br />
Questions to check understanding<br />
Answers to questions, with explanations<br />
Suggestions regarding which topic(s) should be moved on to next.</p>
<p>It is 1 of a set of 5 PowerPoint Presentations on ‘Collecting Data’ that APT Initiatives has published for GCSE Statistics. The content of this PowerPoint is also relevant to the ‘Statistics’ section of the GCSE Maths specifications and included in APT’s PowerPoints for GCSE Maths.</p>
<p>The full set of set of 5 PowerPoints for GCSE Statistics on ‘Collecting Data’ (110 slides excluding Title Pages) covers the following topics:</p>
<p>01 Types of Data (24 slides): Explains the different types of data and how data can be classified according to who collected it.<br />
02 Methods of Collecting Data (31 slides): Reviews the data handling cycle and explains the main methods of collecting data and how to avoid bias, as well as how to record and clean data.<br />
<strong>03 Questionnaires and Surveys (30 slides): Explains the dos and don’ts when designing questionnaires or surveys, reviews grouping data, explains random response techniques and what to do with unexpected responses.</strong><br />
04 Sampling and Bias 1 (25 slides): Defines key statistical terms, outlines how to avoid bias, and explains the main methods of sampling.<br />
05 Sampling and Bias 2 (Application) (20 slides): Reviews and applies different sampling techniques and explains the Petersen capture-recapture method.</p>
<p>This set of 5 PowerPoints are one of 4 sets of PowerPoints that APT Initiatives Ltd has published to support teachers and students of GCSE Statistics. Other sets concern:</p>
<p>Representing Data<br />
Analysing Data<br />
Probability</p>
<p>The purchase of this resource comes with a licence to make the resource available in digital and / or in print form (including photocopying) to the staff and students attending the purchasing institution, ie the individual school / college on a single site. The resource may be distributed via a secure virtual learning environment. It must not be made available on any public or insecure website or other platform. The resource must not be distributed to other institutions that are members of the same academy chain or similar organisation; each individual institution must purchase their own copy of the resource.</p>
<p>This clear, detailed and visually-appealing resource offers a complete reference point for Year 5 children, teachers and parents covering knowledge relating to ‘Data and Information’ as a part of their computing learning.</p>
<p>The organiser has a particular focus on introducing children to using databases, including using databases to search for, sort and filter information. It contains comprehensive sections on:</p>
<p>-Overview;<br />
-Types of Databases;<br />
-Using a Computer Database;<br />
-Presenting Data;<br />
-Using Databases;<br />
-Key Vocabulary.</p>
<p>The content is fully aligned with the age-related expectations for Year 5 children in computing. The resource is designed to be printed onto A3, and is provided as both a PDF and a Word version (so that you can edit if you want to). All images used are licensed for commercial use and are cited on a separate document (included).</p>
A double sided worksheet with solutions. Students need to gather data on pet ownership from the class. This data is then organised into a table. The students then use the data to answer questions and are able to distinguish between the categorical and numerical data gathered. Dot and column graphs are used to show data.<br />
Worksheet could be used as a lesson to show students the difference between these two types of data.<br />
(Australian Curriculum) NSW MA3-18SP uses appropriate methods to collect data and constructs, interprets and evaluates data displays, including dot plots, line graphs and two-way tables
<p>Data collection booklet for the Topic 6 Rivers section of the Edexcel B specification.<br />
Also available as a river fieldwork pack with all accompanying documents (Pupil work pack and A3 Knowledge organiser)</p>
A collection of PowerPoint presentations for teachers to teach a range of topics related to data representation.<br />
<br />
This includes binary, hexadecimal, units of storage, representing sound, and character sets.
 Quick View
 Quick View
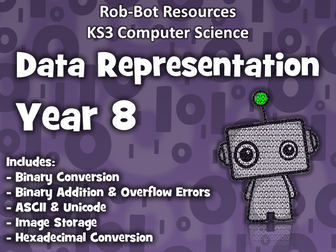 Quick View
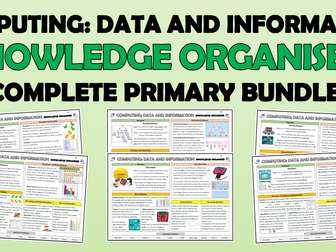 Quick View
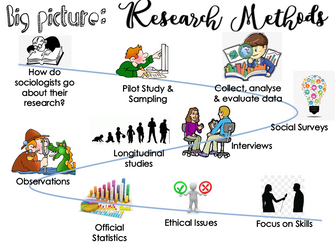 Quick View
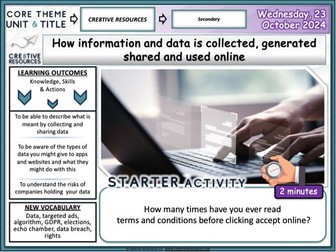 Quick View
 Quick View
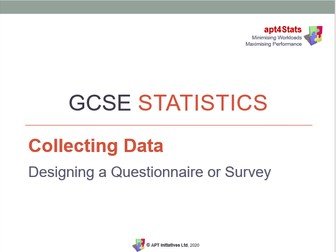 Quick View
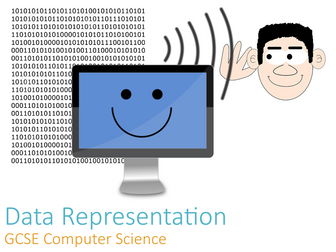 Quick View