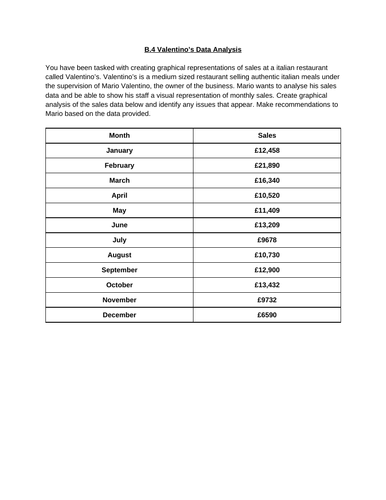

This full lesson, with companion data set, covers B4 of Unit 7: Business Decision Making. The lesson covers;
- Importance of using graphs
- Line Graph
- Pie Chart
- Bar Charts
- Histogram
- Scatter Graph
- Reports to aid in making decisions
The session includes links to external media, group and individual tasks (creating each type of graphs).
Images removed for copywrite reasons, you will need to add your own images e.g. business logos.
Something went wrong, please try again later.
This resource hasn't been reviewed yet
To ensure quality for our reviews, only customers who have purchased this resource can review it
Report this resourceto let us know if it violates our terms and conditions.
Our customer service team will review your report and will be in touch.
£3.00
