Pie chart
Lesson presentations and activities
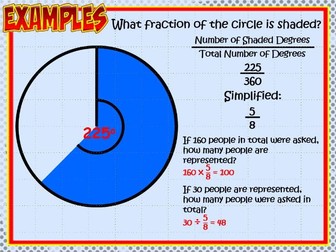
This was taught as a 2 hour lesson to my mid-level year 10 students. Most students managed to achieve both of the learning objectives within the lesson and all achieved with the consolidation tasks.
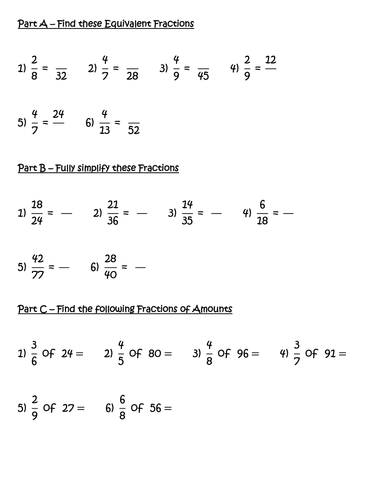
The starter is designed to assess understanding of fractions, equivalent fractions and as proportional representations.
The first task is scaffolded to allow a soft entry into the task and their is an extension to build the understanding of percentages representing proportion of population.
The second extension builds understanding of fractional degrees as a plotting point.
Included in the lesson:
Starter - Fraction assessment
Task 1 - Reading Pie Charts
Extension
Task 2 - Drawing Pie Charts
Extension
Exit ticket - Plenary
Follow on tasks to - Consolidate the skill, Apply the skill & Extend the skill
PowerPointReviews
Sunflower11234 years ago
Fabulous resources, colourful and more to the point really well explained
saritaraos4 years ago
mathscompsci4 years ago
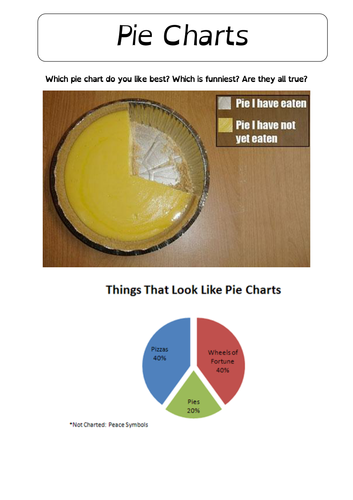
A few pie charts that represent funny ideas or jokes. The idea is that students get a feel for how pie charts work. I used it as a Y7 starter to generate discussion. The 'how often charts don't make sense' pie chart is particularly good for this. As always, please rate and comment with suggests and ideas. Thanks :)
Reviews
umafiesta6 years ago
hhiggins27 years ago
TES Resource Team7 years ago
Thank you for publishing your resource. It has been selected to be featured in a new secondary maths collection.
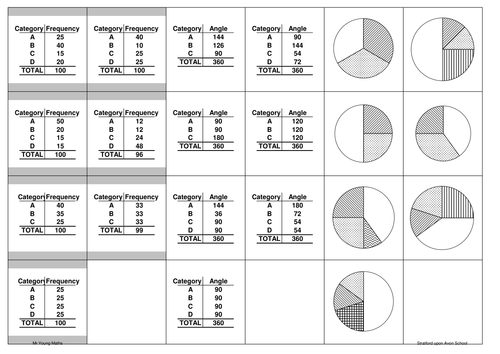
Match up the various tables, graphs and charts into sets,
one or two of the cards are missing and will need to be recreated.Reviews
fdh154 years ago
I love it. Perfect for an extra consolidation and more fun task.
umafiesta6 years ago
8cheese6 years ago
Exactly what I've been looking for, great consolidation activity
Practice questions, homeworks and assessments
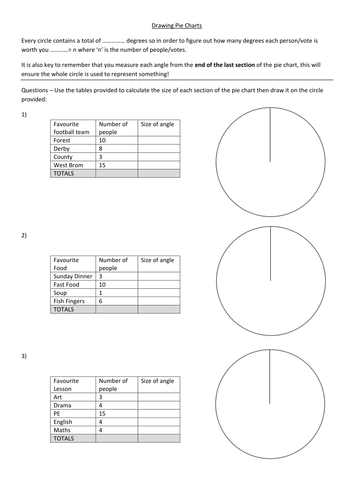
Simple worksheet on drawing Pie Charts with brief instructions at the top. Answers included but feel free to change the football teams to suit your location/preference!
Reviews
hayes_r3 years ago
Circles are too close to the edge of the paper to use a standard sized protractor.
dianeotto5 years ago
Really helpful for a remote learning lesson - thanks.
rachdaniels5 years ago
Thank you!
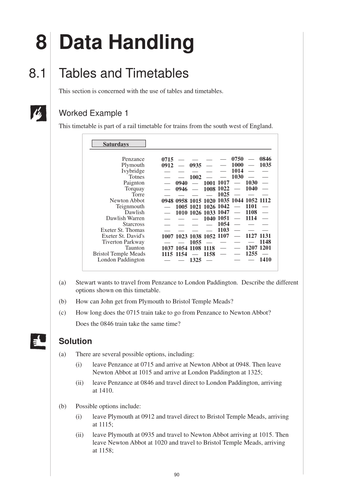
The topic of Data Handling from the GCSE (14 -16 year olds) books of the Mathematics Enhancement Program. For information about these resources and an index for the whole collection please visit https://www.cimt.org.uk/projects/mepres/allgcse/allgcse.htm
Keywords: Questionnaire, Analysis, Question, Biased, Unbiased, Design, Leading, Line Graph, Bar Chart, Process, Display, Conclude, Evidence, Sample, Survey, Multiple Choice, Pilot, Study, Hypothesis, Trend, Bar Chart, Pie Chart, Line Graph, Presentation, Data, Statistics, Scatter Diagram, Graph, Plot, Co-ordinates, Correlation,
Reviews
BPS51115 years ago
Thank you
Mucayit5 years ago
I got great ideas and modify the materials for my students. Ill be teaching the topic two months later so the outcome is still waiting. Thanks for great ideas.
TES Resource Team7 years ago
Thank you for publishing your resource. It has been selected to be featured in a new secondary maths collection.
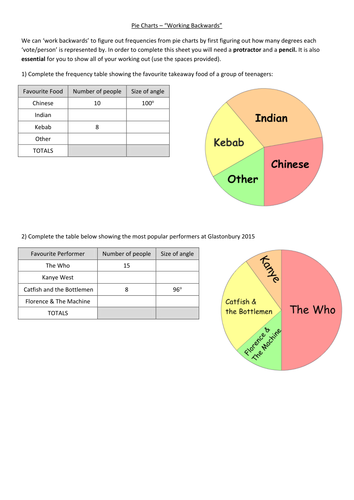
Pupils must measure angles and 'work backwards' to figure out the values represented by the sections of the pie charts. Brief instructions given at the top of the worksheet.
Reviews
TonyM194 years ago
Exactly what I was looking for. Thank you for sharing
lou1990lou7 years ago
Exactly what I was looking for!
TES Resource Team7 years ago
Thank you for publishing your resource. It has been selected to be featured in a new secondary maths collection.
Revision of Pie Charts Exercise using past exam questions
Reviews
Jessie08274 years ago
kiranjha5 years ago
h2osborne5 years ago
Brilliant just what I needed thank you
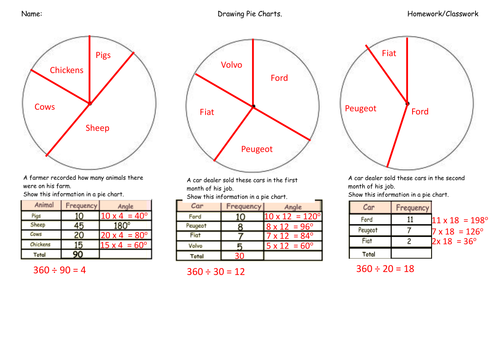
'interpreting pie charts' is the starter activity - allowing for discussion between students and for the teacher to encourage students to deepen their understanding. 'Pie Chart questions'- answers have been provided and would work well printed onto tracing paper for easy checking of the drawings. The worksheet is differentiated where each question requires a bit more working out each time. There is an extension question at the end testing their understanding on interpreting data from a pie chart.
Reviews
jellyladiao5 years ago
Thank you for a very useful activities
martine72705 years ago
Thank you, am using some of the questions as part of a homework booklet.
frances9655 years ago
Thank you for sharing.


