Experienced KS1 and KS2 teacher currently teaching in Year Six. Specialist Leader for Mathematics across three Local Authorities.
All resources have been tried and tested. I'm open to suggestions and requests and aim to help anyone who requires it.
Please leave feedback and rate my resources.
Experienced KS1 and KS2 teacher currently teaching in Year Six. Specialist Leader for Mathematics across three Local Authorities.
All resources have been tried and tested. I'm open to suggestions and requests and aim to help anyone who requires it.
Please leave feedback and rate my resources.
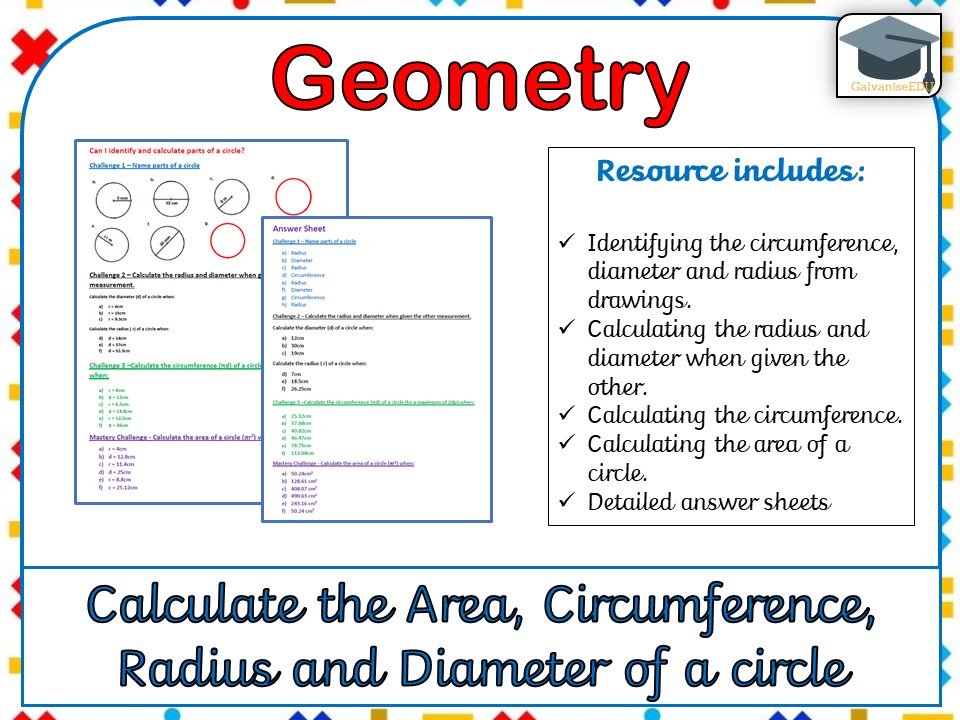
Differentiated activity sheet/ worksheet for KS2/KS3 children.
Challenges include:
Challenge 1 – Name parts of a circle
Challenge 2 – Calculate the radius and diameter when given the other measurement.
Challenge 3 –Calculate the circumference (πd) of a circle (to a maximum of 2dp) when given r, d or c.
Mastery Challenge - Calculate the area of a circle (πr2)
Answer sheet included.
Please leave feedback and look at my other, popular resources.
A two-way differentiated activity sheet/worksheet that will develop the children’s understanding of bar graphs, data handling, averages, negative numbers and data handling vocabulary.
Sheet 1 - 8 Questions asking about the average temperature in three cities across four months.
Sheet 2 - Questions asking about the average temperature in three cities across five months. Averages, decimals and extrapolation skills will be tested.
Answers are provided for both sheets. I have provided two different layouts which also add to the challenge. One has a wider line graph set, the other has a narrower set. This will test children’s adaptability to varying presentations.
Included in this detailed bundle:
Bar charts (including answers)
Line graphs (including answers)
Pie Charts (including answers)
Tally Charts
A massive time saver! Please see individual files for details.
This activity will enable children to have a deeper understanding of percentages off amounts or quantities - a key skill in life.
Included is:
- A pdf version of the questions and answers
- A .doc version of the questions and answers so that you can edit the questions to meet your class' individual needs.
These are excel spreadsheets Gap Analysis documents for the 2016 Year Two SATs Papers for Maths .
The sheet totals up the scores automatically and each child’s final score changes colour to reflect their ability.
If their total score for a subject goes green, it means they would have passed the 2016 SATs with that score. If it goes Green with a yellow font, it means that child would have achieved a ‘More Able’ score for that tested subject.
I have also included an instructions and document page, linking to a freely available copy of each test, mark scheme and instructions. Additionally, I have included a link to the conversion tables from RAW Score to Scaled Score.
All a teacher has to do is enter their children’s names and enter the 0’s, 1’s, 2’s or 3’s for each question, which also change colour too for a visual reference. I recommend that a teacher should enter ‘N’ if a child did not attempt that question. This gives an idea of who is not even attempting certain questions, not just whether they got the question wrong.
The sheets are set up for 32 pupils but more can be added/deleted and instructions are on the first page/sheet. Some cells are locked/protected in this document but the parts that you need to insert yourself are editable. This is so that the formulas/algorithms do not break and render the spreadsheet’s functionalities as broken.
I take requests for Gap Analysis Grids. Please leave feedback if you like this resource as I am planning to produce more for each SATs paper going forward, as well as CGP Practice Papers.
Please remember to rate this resource as I made this to save teachers time. Thank-you.
These are excel spreadsheets Gap Analysis documents for the 2017 Year Two SATs Papers for Maths .
The sheet totals up the scores automatically and each child’s final score changes colour to reflect their ability.
If their total score for a subject goes green, it means they would have passed the 2017 SATs with that score. If it goes Green with a yellow font, it means that child would have achieved a ‘More Able’ score for that tested subject.
I have also included an instructions and document page, linking to a freely available copy of each test, mark scheme and instructions. Additionally, I have included a link to the conversion tables from RAW Score to Scaled Score.
All a teacher has to do is enter their children’s names and enter the 0’s, 1’s, 2’s or 3’s for each question, which also change colour too for a visual reference. I recommend that a teacher should enter ‘N’ if a child did not attempt that question. This gives an idea of who is not even attempting certain questions, not just whether they got the question wrong.
The sheets are set up for 32 pupils but more can be added/deleted and instructions are on the first page/sheet. Some cells are locked/protected in this document but the parts that you need to insert yourself are editable. This is so that the formulas/algorithms do not break and render the spreadsheet’s functionalities as broken.
I take requests for Gap Analysis Grids. Please leave feedback if you like this resource as I am planning to produce more for each SATs paper going forward, as well as CGP Practice Papers.
Please remember to rate this resource as I made this to save teachers time. Thank-you.
A complete bundle of Gap Analysis Grids / QLA (Reading, GPS, Spelling, Arithmetic and Reasoning) for the 2017 KS1 SATs assessments. I have also included links to the papers, the mark schemes and the conversion grids within each spreadsheet.
This resource contains an editable A3-sized Place Value grid that is colourful and large enough to put counters on for a fun, practical (concrete) Maths activity. I currently have 30 of these laminated for use.
One side has the place value columns written in words and the other as numerals.
The PowerPoint that accompanies this is perfect for input and covers:
- Reading numbers expressed on a place value grid.
- Writing numbers expressed as counters.
- Recognising what happens when we shift counters left and right.
- and more…
Featuring fully-interactive Millionaire Quizzes for Ancient Rome, Roman Britain, two differentiated Roman Numerals quizzes and two Roman Numerals activities, this bundle will save you time and hours of work.
This bundle includes fun ways to master fraction, decimal and percentage equivalencies.
1. An activity that uses short division and multiplying by 100 to convert a fraction into a decimal and percentage.
2. A fun, whole class Quiz, Quiz, Trade game.
3. Two fully interactive and hugely fun Millionaire Quiz! games for assessing progress.
4. Practice KS2 Sats questions in the form of a powerpoint.
Used to great success in Years 4, 5 and 6.
This resource contains three differentiated codebreaking activities that will help you assess children's understanding of BIDMAS/BODMAS. Each activity has a detailed answer sheet with it. Furthermore, on each sheet there is an optional speed challenge - perfect for building up fluency.
Bronze level – Brackets, Multiplication, Division, Addition and Subtraction.
Silver Level – introduces indices and square roots.
Gold Level – introduces decimals.
A massive time-saving resource that'll save you hours! Covers all the KS2 expectations for mixed numbers and improper fractions.
Five differentiated activity sheets, each differentiated four ways. Included are opportunities for children to create pictorial representations of fractions, interpret pictorial representations of fractions, practice their fluency skills, use mathematical language in reasoning responses and problem solve.
Sheet 1 - Add two mixed numbers together - WITH ANSWER SHEET
Sheet 2 - Subtract a mixed number from another mixed number. - WITH ANSWER SHEET
Sheet 3 - Convert an improper fraction into a mixed number. - WITH ANSWER SHEET
Sheet 4 - Convert a mixed number into a proper fraction. - WITH ANSWER SHEET
Sheet 5 - Multiply a mixed number by an integer. - WITH ANSWER SHEET
Additionally, children will practise their simplifying skills throughout all five sheets.
Word versions have also been included so you can adapt each activity to your own cohort.
Included in this bundle are three complete suites of Gap Analysis / Question Level Analysis grids for the 2016, 2017 and 2018 KS2 SATs.
Every paper, every question.
Grids change colour depending on whether questions have been answered correctly and the grids auto calculate scores, indicating pass/fail or greater depth.
Please see individual resources for more details.
A complete bundle of Gap Analysis Grids / QLA (Reading, GPS, Spelling, Arithmetic, Reasoning 1, Reasoning 2) for the May 2018 KS2 SATs assessments. I have also included links to the papers, the mark schemes and the conversion grids within each spreadsheet.
These grids will save you many hours work and will help you quickly identify individual or whole cohort weaknesses in specific areas of the curriculum.
The sheets are set up for 90 pupils but more can be added/deleted and instructions are on the first page/sheet. Some cells are locked/protected in this document but the parts that you need to insert yourself are editable. This is so that the formulas/algorithms do not break and render the spreadsheet’s functionalities as broken. Please read the description of each resource before purchasing.
Please remember to leave feedback as I am aiming to build a reputation as a creator who aims to save teachers time and improve their effectiveness.
Designed to easily fit into an exercise book without folding, this activity sheet focuses on the national expectations for children with regards to 3D polygons. An editable version has been included for you to adapt the activity to your class, if required. Additionally, a robust answer sheet is included.
Children will need to:
-Name each 3D polygon
Identify the number of faces
Identify the number of vertices
Identify the number of edges
These are excel spreadsheet Gap Analysis documents for the 2018 Year Two SATs Papers for Maths .
The sheet totals up the scores automatically and each child’s final score changes colour to reflect their ability.
If their total score for a subject goes green, it means they would have passed the 2018 SATs with that score. If it goes Purple with a White font, it means that child would have achieved a ‘More Able’ score for that tested subject.
I have also included an instructions and document page, linking to a freely available copy of each test, mark scheme and instructions. Additionally, I have included a link to the conversion tables from RAW Score to Scaled Score.
All a teacher has to do is enter their children’s names and enter the 0’s, 1’s or 2’s for each question, which also change colour too for a visual reference. I recommend that a teacher should enter ‘N’ if a child did not attempt that question. This gives an idea of who is not even attempting certain questions, not just whether they got the question wrong.
The sheets are set up for 32 pupils but more can be added/deleted and instructions are on the first page/sheet. Some cells are locked/protected in this document but the parts that you need to insert yourself are editable. This is so that the formulas/algorithms do not break and render the spreadsheet’s functionalities as broken.
I take requests for Gap Analysis Grids. Please leave feedback if you like this resource as I am planning to produce more for each SATs paper going forward, as well as CGP Practice Papers.
Please remember to rate this resource as I made this to save teachers time. Thank-you.
Complete suite of Gap Analysis grids for the 2016 , 2017 & 2018 KS1 SATs. Reading, Maths and GPS papers for each year plus links to the matching assessments.
Please read each resources page for a more detailed breakdown of the contents.
Included in this bundle are three complete suites of Gap Analysis / Question Level Analysis grids for the 2016, 2017, 2018 and 2019 KS1 SATs.
Every paper, every question.
Grids change colour depending on whether questions have been answered correctly and the grids auto calculate scores, indicating pass/fail or greater depth.
Please see individual resources for more details.
This is a two-challenge activity sheet/worksheet aimed at children in Years 5-7.
Children are asked to put fractions in ascending and descending order when their denominators are not the same. This tests their knowledge of fractions, common multiples and simplification.