73Uploads
11k+Views
3k+Downloads
All resources

Mathematics Intervention: 11 - Scatter Graphs
I have created a series of 17 workbooklets to be used with low ability KS3 students.
They can be purchased individually, or all 17 (plus 2 x trackers) can be purchased as a bundle.
Excellent for interventions.

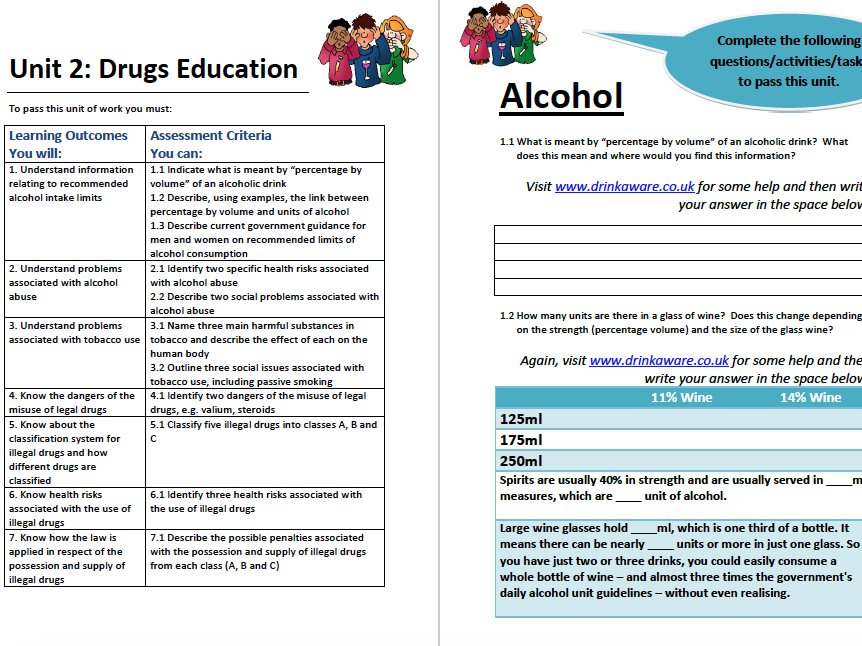
Personal and Social Education: AQA Level 1 Workbook
Level 1 Award in Personal and Social Education QCF 500/3050/4
To achieve a Level 1 Award you must complete four units of work. The units that will be covered are:-
Unit 2: Drugs Education
Unit 3: Sex and relationship Education
Unit 4: Personal Finance
Unit 6: Healthy Lifestyles

3D Shapes, Properties, Volume & Surface Area
Learning Objectives:-
• Identify the properties of 3D shapes including cubes, cuboids, cylinders, pyramids, cones and spheres.
• Know and apply formulae to calculate volumes of cuboids and other right prisms (including cylinders)
• Calculate the surface area of spheres, pyramids, cones and composite solids.

AQA Entry Level Maths: Unit 1 Properties of Number
Unit 1: Properties of Number PPT
PPT which covers all the topics in Unit 1 of the AQA Entry Level Qualification (Level EL1 - ELC3)

Congruence & Similarity
Learning Objectives:-
Apply the concepts of congruence and similarity
Use the basic congruence criteria for triangles

Properties of Polygons
Learning Objectives:-
Derive and apply properties of polygons (and know their names)
Correctly use geometrical terms, label triangle sides and angles and draw diagrams from written descriptions
Calculate interior and exterior angles in regular polygons
Identify lines or symmetry and rotational symmetry order

Histograms
Learning Objectives:-
Construct and interpret histograms with equal class widths (for grouped discrete as well as continuous data)
Construct and interpret histograms with unequal class widths (for grouped discrete as well as continuous data)

Sampling & Population
Learning Objectives:-
Apply statistics to describe a population
Infer properties of populations or distributions from a sample, whilst knowing the limitations of sampling
Use measures of central tendency and measures of spread to interpret, analyse and compare the distributions of data sets

Angles & Constructions
Learning Objectives:-
Know angle types, label triangle sides and angles
Apply properties of quadrilaterals to know their names and find missing angles
Apply the properties of angles at a point, angles on a straight line, vertically opposite angles, alternate angles and corresponding angles
Use the standard ruler and compass constructions to construct a 60° angle, a perpendicular bisector, a perpendicular to a given line from/at a given point, and an angle bisector

Loci, Plans & Elevations
Learning Objectives:-
Use constructions to solve loci problems
Construct and interpret plans and elevations for 3-D shapes.

Trigonometry
Learning Objectives:-
Know and use trigonometric ratios for right-angled triangle to:-
Find the length of a missing side
Find the size of a missing angle

Decimals & Standard Form
Learning Objectives:-
Understanding the place value of decimals
Multiply decimals using written methods
Divide decimals using written methods
Add and Subtract decimals using written methods
Rounding to decimal places or significant figures
Estimate Answers
Understand and use standard form for very large and very small numbers

Straight-line Graphs
Learning Objectives:-
Be able to name and draw horizontal and vertical equations
Be able to draw an equation onto axis using the table method
Identify and interpret gradients and intercepts of linear functions, both algebraically and graphically.

Simplifying, Factorising & Brackets
Learning Objectives:-
Simplify algebraic expressions by collecting like terms (adding and subtracting)
Expanding brackets
Take out common factors to factorise
Factorising and expanding quadratics

Indices
Learning Objectives:-
Simplify expressions involving sums, products and powers, including using index laws
Calculate with negative and fractional indices

Cumulative Frequency, Box Plots & Comparing Distributions
Learning Objectives:-‐
Construct and interpret cumulative frequency
diagrams (for grouped discrete as well as
continuous data)
Interpret and construct box plots
Use measures of central tendency and measures
of spread to interpret, analyse and compare the
distributions of data sets

Probability & Venn Diagrams
Learning Objectives:-‐
• Describe the probability of an event occurring
using probability words
• Use a probability scale
• Theoretical Probability and Mutually exclusive
events
• Relative frequency
• Enumerate sets and combinations of sets
systematically, using tables and grids
• Record, describe and analyse the frequency of
outcomes of probability experiments using tables
and frequency tress (probabilities as fractions,
decimals or percentages)
• Enumerate sets and combinations of sets
systematically, using Venn Diagrams

Area & Perimeter of Regular & Composite Shapes
Learning Objectives:-
Calculate the perimeter of shapes
Calculate the areas of Rectangles, Triangles and Parallelograms
Calculate the areas of Trapeziums, Rhombus and Kites
Calculate the area of composite shapes

Circle Theorems
Learning Objectives: -
Apply and prove the standard circle theorems concerning angles, radii, tangents and chords, and use them to prove related results

Bearings & Maps
Learning Objectives:-
To find a bearing from A to B
To find a return bearing from B to A
To understand the points on a compass and the angles of each point
To use scale to work out distance from one bearing to another


