62Uploads
68k+Views
13k+Downloads
Mathematics

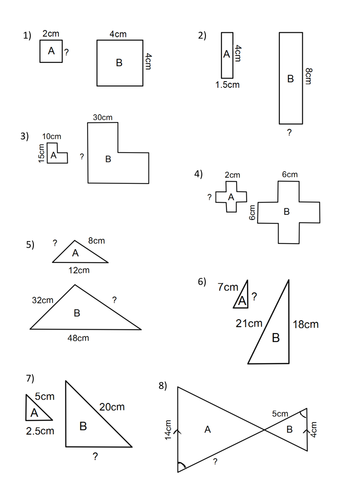
Understanding scale factor
8 questions where pupils can find the scale factor from A to B and then use this to find the missing lengths.

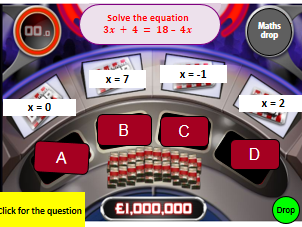
Solving Equations Million Pound Drop
20 questions starting from simple one step equations, building up to solving equations with unknowns on both sides. Multiple choice questions address misconceptions. Includes one practise question.
Sorry I cannot credit the person who created the formatting.
Bundle

GCSE Maths Bundle
18 resources, including lessons, worksheets and cart sorts. All suitable for the new 1-9 GCSE.
Includes a No Pens Day Wednesday lesson and resource, which is great for promoting literacy and oracy.

Vertical and Horizontal Lines
A card sort (word document) for horizontal and vertical lines.
A worksheet on recognising vertical and horizontal lines from their coordinates.
A worksheet on drawing vertical and horizontal lines (using colours).

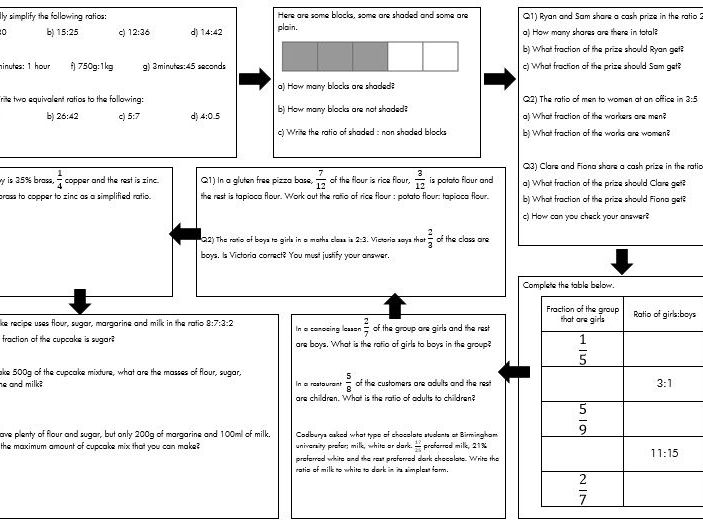
Writing a ratio as a fraction
This topic has been focused on recently in the new GCSE. This worksheet starts with simplifying ratio, onto a visual comparison, then onto writing a ratio as a fraction. Their skills are then tested by converting between fractions and ratios. Questions get challenging and students need to use skills from other areas of mathematics.
Please leave feedback so that this resource can be improved.

Standard Deviation Worksheet
8 questions on standard deviation. The first two questions include the table for ease. The last question is a comparison between standard deviation and the mean.

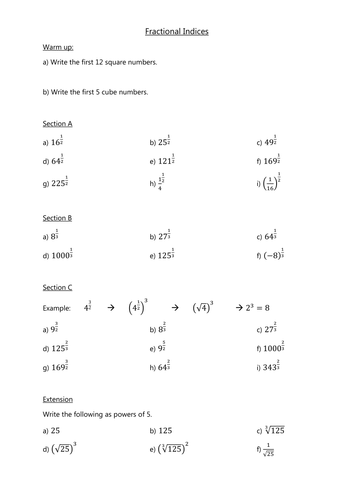
Fractional indices worksheet
Three differentiated sections on fractional indices. Including an extension task.

Back to back stem and leaf diagram
Starter - Comparing pie charts.
Activity - Interactive collection of data involving pulse rates.
Worksheet - Drawing back to back stem and leaf diagrams and finding the range and median.
Extension - comparison using the range and median.
Please rate and leave feedback.

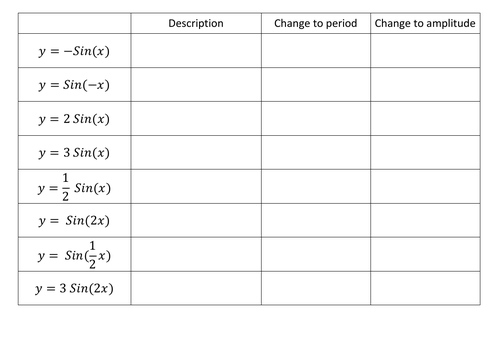
Transforming Trig Graphs - Sine and Cosine
A lesson on plotting Sine and Cosine, and transforming the curve. Worksheets and answers provided, alongside a Desmos interactive demonstration.

Income Tax and National Insurance Exam Style Questions
AQA syllabus, using the 2020 - 2021 preliminary material.
6 exam questions, based on previous exam styles. Worked solutions included.

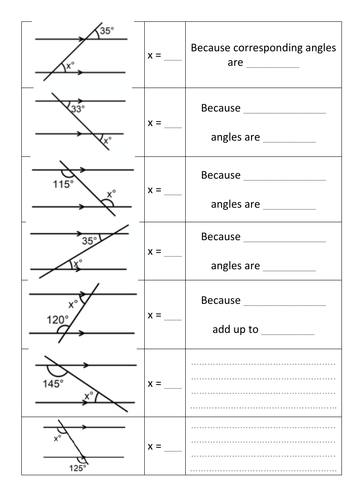
Angles in parallel lines (low ability)
Write on worksheet for low ability students . Structure of sentences to support.

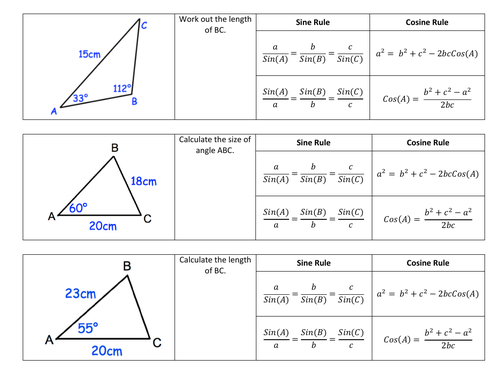
Sine and Cosine Rule
This gives students practise of recognising which rule to use for which triangle. Complete with solutions.

Shape and Space Quiz
Multiple choice quiz on shape and space. Includes area and circumference of a circle, perimeter and area of quadrilaterals, naming 3D shapes and their properties and plans and elevations.

Transformations of functions
GCSE A*, Core 1
A card sort for the transformation of functions, including vector form.
A matching activity for transformation and their vectors.

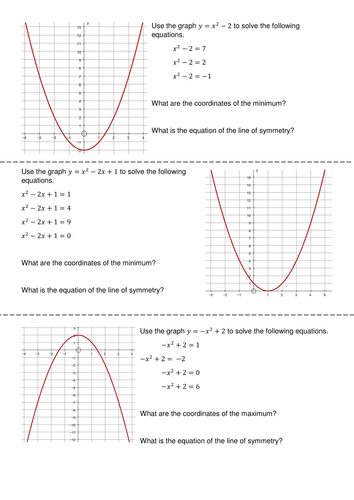
Solving Quadratic Graphs Graphically
A structured worksheet on solving quadratics graphically. Includes coordinates for the minimum/maximum and finding the line of symmetry.

Adding, subtracting, multiplying and dividing surds
Surds, Grade A, Adding, Subtracting, Multiplying, Dividing, Irrational, four operations

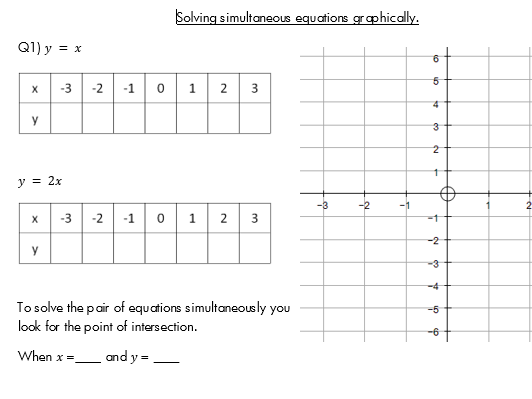
Solving simultaneous equations graphically
A flip chart showing an introduction and an example (along with extension questions). The worksheet has four practise questions for students to use.

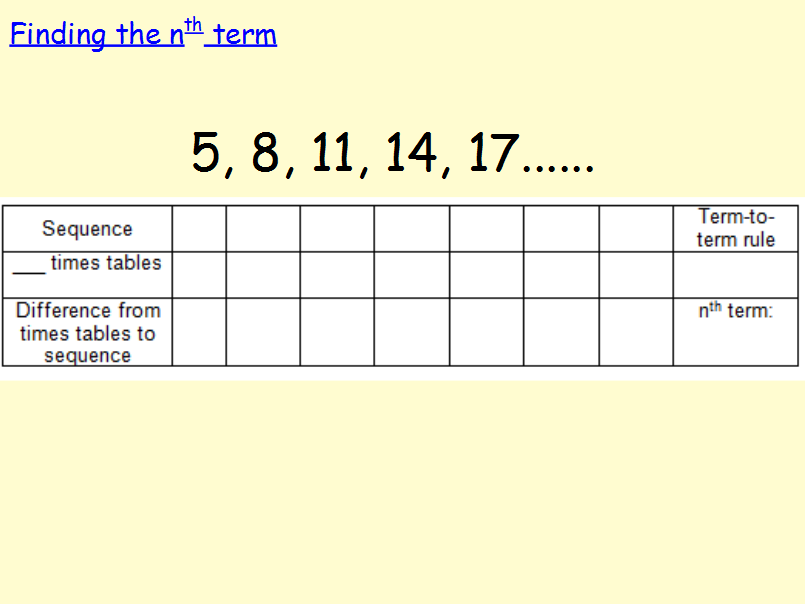
nth term linear
A flip chart lesson starting from term to term rules, building up to nth term and then working out if a number is in a sequence. RAG questions with answers included.
Scaffolded worksheet on finding the nth term. Starting from simple (2n+1) building up to subtraction (3n-6), and then negative terms (-2n+1).

Time series, moving averages and mean seasonal variation
GCSE Statistics:
Three worksheets on:
1) Comparing time series graphs and then plotting.
2) Calculating moving averages and plotting.
3) Calculating the mean seasonal variation.
Peer assessment task on comparing time series graphs (GCSE exam question)

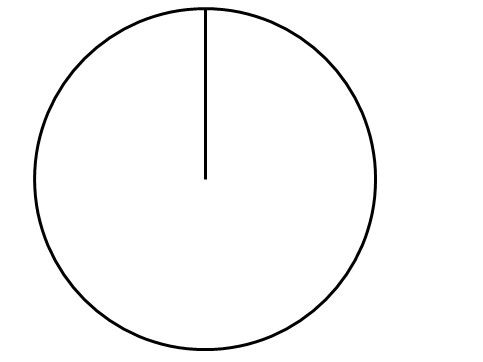
Drawing Pie Charts
12 questions on completing tables and drawing pie charts.
Starts with simple multiplication such as 180 to 360. Then uses scaling to complete more difficult tables: i.e. 45 - 90 - 180 - 360 and then drawing the pie chart.
Circle is drawn with radius for support.

