I have been a teacher for over 20 years - all the stuff I upload has been tried and tested in my classroom. I don't mind a discussion on Twitter too where I also share new resources. I now have a personal website: https://andylutwyche.com/
I have been a teacher for over 20 years - all the stuff I upload has been tried and tested in my classroom. I don't mind a discussion on Twitter too where I also share new resources. I now have a personal website: https://andylutwyche.com/
Scooby and the gang are pursuing various ghosts/monsters on different curves but health and safety have visited Mystery Incorporated and told them the gradients that are safe to drive/slide along. Can you help Velma, Daphne, Fred, Shaggy and Scooby with these curvy conundrums?
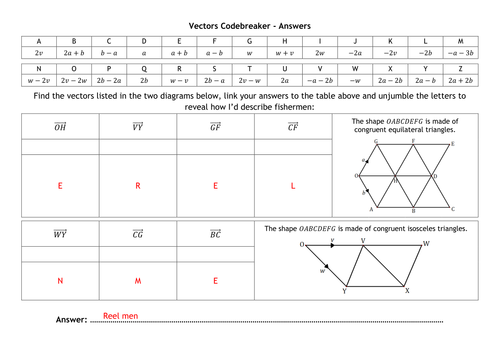
A really lame joke (more lame than usual if you can get your head around that) but some reasonably straight forward vectors practise. It could be used to as a starter or plenary and students could design their own routes.
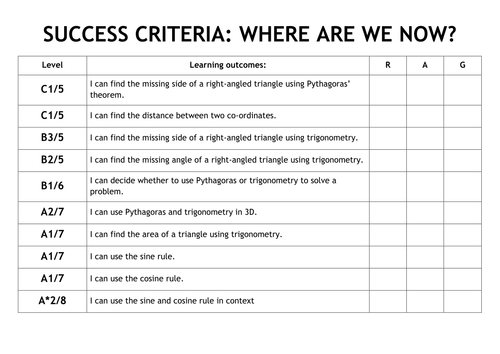
This is a powerpoint covering Pythagoras and trigonometry in 2D and 3D, then moving on to the sine and cosine rules. It contains brief notes by way of an explanation, model answers to questions and a question or two for the students to do; all of the questions come with answers that you can display when ready. The slide show comes with a progress grid (regularly referred to in the presentation) so that students can mark their progress from start to finish and pinpoint any areas that may need extra work with a “red/amber/green” system that they fill in; each one is given an approximate grade in both new (2017 onwards) and old system in England. It’s what I use in my lessons before setting tasks from worksheets or text books to practise.
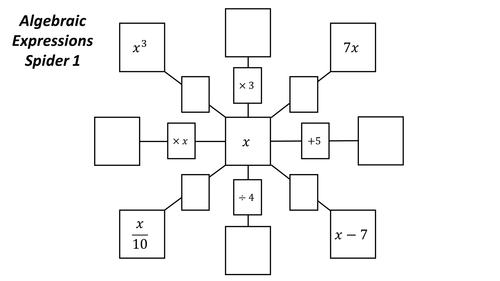
Four "spiders" to help students become comfortable with algebra and manipulating expressions. There is an extension one at the end and the opportunity for discussion about whether there are many answers etc. I have left some blank ones for students to make up their own.
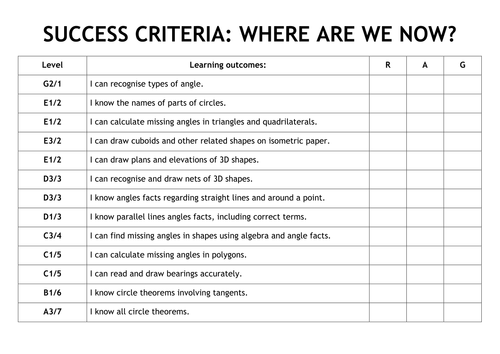
This is a powerpoint covering shapes and their properties, angles facts including circle theorems and bearings. It contains brief notes by way of an explanation, model answers to questions and a question or two for the students to do; all of the questions come with answers that you can display when ready. The slide show comes with a progress grid (regularly referred to in the presentation) so that students can mark their progress from start to finish and pinpoint any areas that may need extra work with a “red/amber/green” system that they fill in; each one is given an approximate grade in both new (2017 onwards) and old system in England. It’s what I use in my lessons before setting tasks from worksheets or text books to practise.
This is a powerpoint covering symmetry, reflection, rotation, translation and enlargement and on to vectors. It contains brief notes by way of an explanation, model answers to questions and a question or two for the students to do; all of the questions come with answers that you can display when ready. The slide show comes with a progress grid (regularly referred to in the presentation) so that students can mark their progress from start to finish and pinpoint any areas that may need extra work with a “red/amber/green” system that they fill in; each one is given an approximate grade in both new (2017 onwards) and old system in England. It’s what I use in my lessons before setting tasks from worksheets or text books to practise.
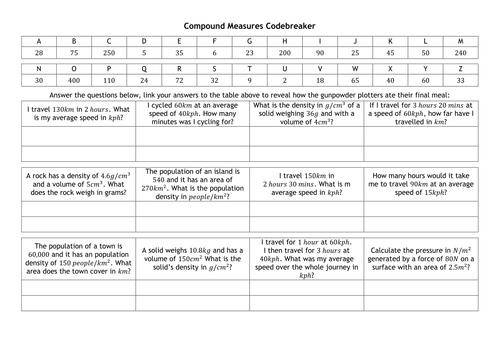
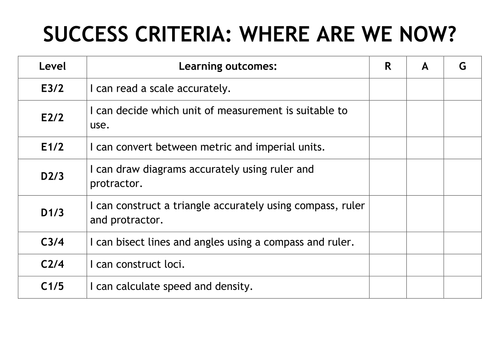
This is a powerpoint covering unit conversions, constructions, loci, speed and density. It contains brief notes by way of an explanation, model answers to questions and a question or two for the students to do; all of the questions come with answers that you can display when ready. The slide show comes with a progress grid (regularly referred to in the presentation) so that students can mark their progress from start to finish and pinpoint any areas that may need extra work with a “red/amber/green” system that they fill in; each one is given an approximate grade in both new (2017 onwards) and old system in England. It’s what I use in my lessons before setting tasks from worksheets or text books to practise.
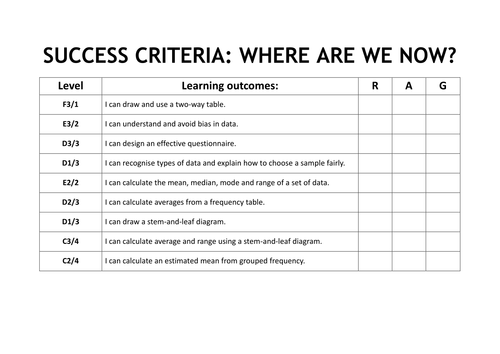
This is a powerpoint covering surveys, avearges including from tables, stem-and-leaf diagrams and grouped data. It contains brief notes by way of an explanation, model answers to questions and a question or two for the students to do; all of the questions come with answers that you can display when ready. The slide show comes with a progress grid (regularly referred to in the presentation) so that students can mark their progress from start to finish and pinpoint any areas that may need extra work with a “red/amber/green” system that they fill in; each one is given an approximate grade in both new (2017 onwards) and old system in England. It’s what I use in my lessons before setting tasks from worksheets or text books to practise.
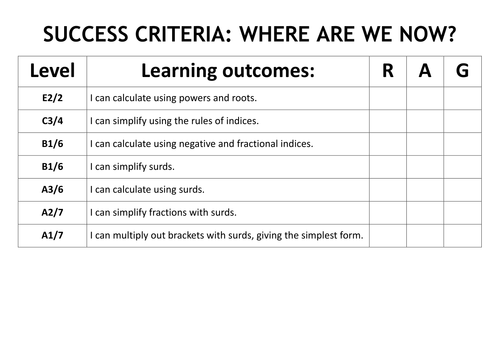
This is a powerpoint covering rules of indices and simplifying before moving on to surds including simplifying, calculating and rationalising denominators. It contains brief notes by way of an explanation, model answers to questions and a question or two for the students to do; all of the questions come with answers that you can display when ready. The slide show comes with a progress grid (regularly referred to in the presentation) so that students can mark their progress from start to finish and pinpoint any areas that may need extra work with a “red/amber/green” system that they fill in; each one is given an approximate grade in both new (2017 onwards) and old system in England. It’s what I use in my lessons before setting tasks from worksheets or text books to practise.
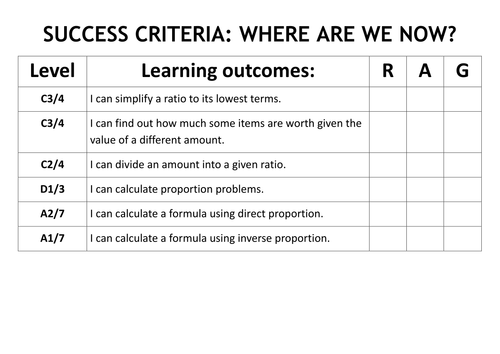
This is a powerpoint coveringratio from simplifying to sharing before moving onto proportion. It contains brief notes by way of an explanation, model answers to questions and a question or two for the students to do; all of the questions come with answers that you can display when ready. The slide show comes with a progress grid (regularly referred to in the presentation) so that students can mark their progress from start to finish and pinpoint any areas that may need extra work with a “red/amber/green” system that they fill in; each one is given an approximate grade in both new (2017 onwards) and old system in England. It’s what I use in my lessons before setting tasks from worksheets or text books to practise.
This is a powerpoint covering simplifying expressions along with forming and using formulae. It contains brief notes by way of an explanation, model answers to questions and a question or two for the students to do; all of the questions come with answers that you can display when ready. The slide show comes with a progress grid (regularly referred to in the presentation) so that students can mark their progress from start to finish and pinpoint any areas that may need extra work with a “red/amber/green” system that they fill in; each one is given an approximate grade in both new (2017 onwards) and old system in England. It’s what I use in my lessons before setting tasks from worksheets or text books to practise.
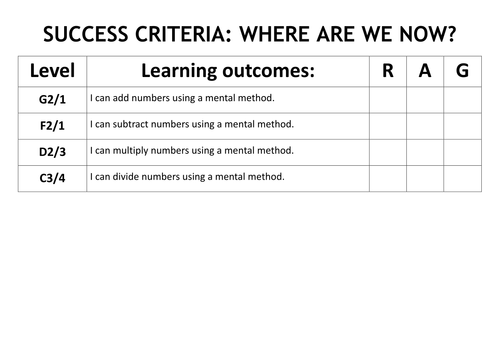
This is a powerpoint covering the topics listed. It contains brief notes by way of an explanation, model answers to questions and a question or two for the students to do; all of the questions come with answers that you can display when ready. The slide show comes with a progress grid (regularly referred to in the presentation) so that students can mark their progress from start to finish and pinpoint any areas that may need extra work with a “red/amber/green” system that they fill in; each one is given an approximate grade in both new (2017 onwards) and old system in England. It’s what I use in my lessons before setting tasks from worksheets or text books to practise.
This is a powerpoint covering expanding single and double brackets and factorising into single and double brackets. It contains brief notes by way of an explanation, model answers to questions and a question or two for the students to do; all of the questions come with answers that you can display when ready. The slide show comes with a progress grid (regularly referred to in the presentation) so that students can mark their progress from start to finish and pinpoint any areas that may need extra work with a “red/amber/green” system that they fill in; each one is given an approximate grade in both new (2017 onwards) and old system in England. It’s what I use in my lessons before setting tasks from worksheets or text books to practise.
This is a powerpoint covering solving equations of increasing difficulty. It contains brief notes by way of an explanation, model answers to questions and a question or two for the students to do; all of the questions come with answers that you can display when ready. The slide show comes with a progress grid (regularly referred to in the presentation) so that students can mark their progress from start to finish and pinpoint any areas that may need extra work with a “red/amber/green” system that they fill in; each one is given an approximate grade in both new (2017 onwards) and old system in England. It’s what I use in my lessons before setting tasks from worksheets or text books to practise.
This is a powerpoint covering simultaneous equations of increasing diffuculty. It contains brief notes by way of an explanation, model answers to questions and a question or two for the students to do; all of the questions come with answers that you can display when ready. The slide show comes with a progress grid (regularly referred to in the presentation) so that students can mark their progress from start to finish and pinpoint any areas that may need extra work with a “red/amber/green” system that they fill in; each one is given an approximate grade in both new (2017 onwards) and old system in England. It’s what I use in my lessons before setting tasks from worksheets or text books to practise.
This is a powerpoint covering sequences from continuing, using the nth term, finding the nth term and briefly covering quadratic sequences. It contains brief notes by way of an explanation, model answers to questions and a question or two for the students to do; all of the questions come with answers that you can display when ready. The slide show comes with a progress grid (regularly referred to in the presentation) so that students can mark their progress from start to finish and pinpoint any areas that may need extra work with a “red/amber/green” system that they fill in; each one is given an approximate grade in both new (2017 onwards) and old system in England. It’s what I use in my lessons before setting tasks from worksheets or text books to practise.
All these sheets are available individually for free but if you want to download the lot in one hit then this is for you. These are revision sheets on Data, Algebra, Number, Geometry (hence "DANG"). Each sheet has 6 sections covering the aspects listed in brackets of Data (average, probability, frequency tables, grouped frequency, interpreting bar charts), Algebra (simplifying expressions, solving equations, sequences, y=mx+c, inequalities, substitution), Number (properties of number, BIDMAS, ratio, fractions/percentages, indices, rounding/estimation) and Geometry (measures, angles, perimeter/area/volume, properties of shapes, speed/density, Pythagoras/Trigonometry) up to around B/C or 5/6 grade. All the instructions are on each sheet. Ideal for revision, homework, cover lessons or as a whole class discussion lesson.
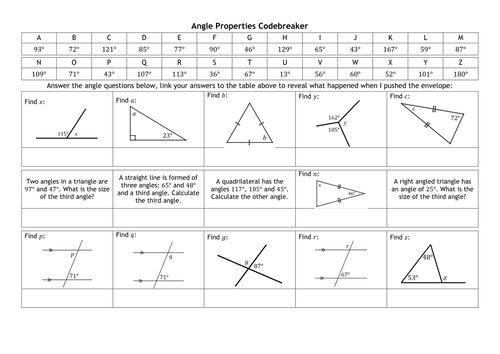
This covers angles on a line, in a triangle, in a quadrilateral and parallel lines both diagrams and worded. Angles in polygons is covered on another one. The joke had to be edited to fit but still as cheesy as one would hope.