18Uploads
2k+Views
43Downloads
All resources

Graphing Double Bar Graphs
Students will be able to examine raw data on a table, and use it to construct a double bar graph.

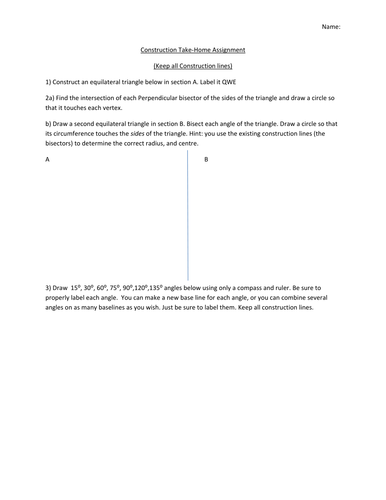
Constructing Angles and Triangles Quiz
A quiz asking students to construct various angles without a protractor. Also constructing a triangle with specified lengths, without a protractor. I gave this as a take-home assignment but it can be used as a test or a lesson.

Novel Study Questions and Discussions
Use this differentiated, scaled, universal approach to novel studies.
This can be used for individual novels, or a class set. It can be used for all types of grade levels. Students can choose the intricacy and difficulty of their submissions.
These can also be used as class discussion questions. The possibilities are endless. Save yourself the prep time.

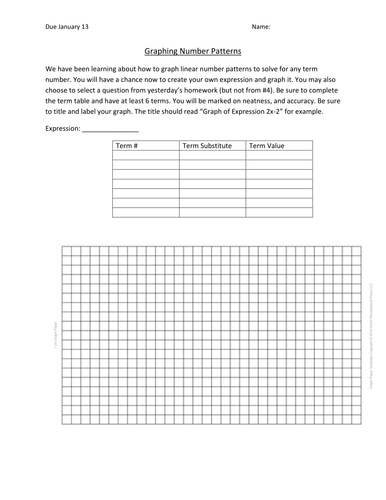
Graphing from a Table of Values Powerpoint
A PowerPoint showing students how to graph a line on a co-ordinate grid from a table of values. Shows step-by-step instructions. Visually demonstrates the plotting process.

How to Read and Create a Stacked Bar Chart/Stacked Bar Graph
Short introduction about interest and loans followed by the lesson on Bar Charts/Bar Graphs.
A few examples at the end of the presentation.

Law of Cosines
Could not find anything like this here, so I made one up. A very simple, easy to follow presentation that uses inquiry to keep students engaged. There is an example on the presentation with step-by-step instructions.

Sin law
I could not find anything like this on here, so I made one up myself. This presentation describes the Sin law, and an example of how to use the law to find a side length.

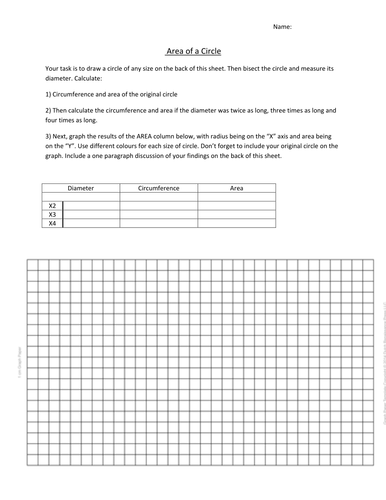
Area of a circle (with graphing component)
Students discover the relationship between the diameter of a circle and its area. They graph the results.

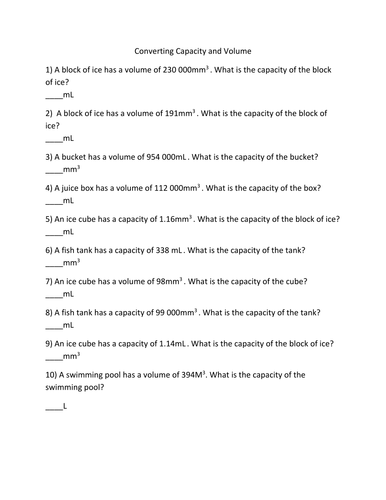
Converting Capacity and Volume
Converting Capacity and Volume worksheet. Very simple straight-forward questions. I used this for curriculum modification purposes, and for learners with accommodations.

Calculating Slope or Gradient from a linear equation
Calculating Slope or Gradient from a linear equation. Visually demonstrates step-by-step process, includes real life meaning behind gradient and how we use it.

Inquiry Math Table Trouble
In this open-ended inquiry problem, students solve a situation where x number of people need to sit at y number of tables. Completely opened-ended with various solutions. Great for group work and problem solving.

Calculating Interest (simple and compound)
A simple presentation on calculating interest. Gives students some financial literacy and teaches them how to calculate simple and compound interest via a step-by-step process.

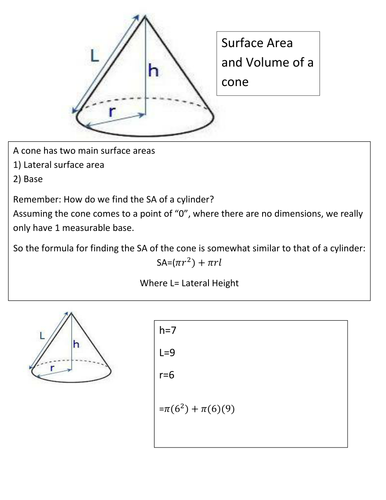
Surface Area of a Cone
Simple Handout that shows the steps and rational behind finding the surface area of a cone. Can be used as a slide on a powerpoint.

Measuring Angles and Side Lengths of Triangles
Students will start from scratch, learning first how to label a triangle. Then measure its side lengths, then finally measuring the angles.

Health Assignment (inquiry)
Pre-assignment= Students should know what foods are healthy, and what foods they should eat in moderation.
This assignment can be used for Grades 5, 6,7 and 8. (11-13 year olds). It can also be used as an Art project, Media Studies etc.
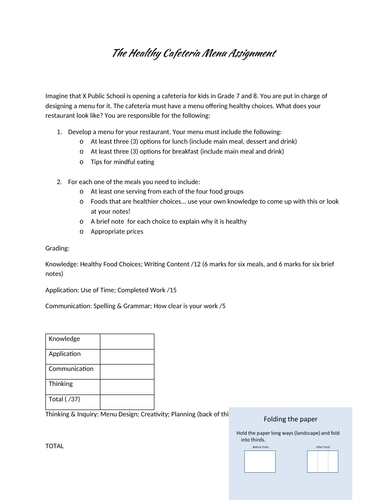
In this assignment, students create their own menu for a fictional restaurant. They use their knowledge of what is a healthy meal to be included in the menu. Students use a website to create this menu. (I like this site because the templates make it easy for beginners, and students who are good with computers can really shine).
The file includes a READ ME, the assignment (with marking guide), website link, planning page and an example.

Graphing Double Bar Graphs2
In this task, students look at raw data on a table, and use it to construct a double bar graph. Inquiry question included.

Health: Cafeteria Assignment; Grades 5-8
This could be used for the completion of a “Healthy Eating” unit in Health. Students can use piktochart or simply fold an A-5 or Letter sized paper in thirds. My students loved this one.


