Hero image

Chemladdie's Science Resources

Average Rating3.00
(based on 1 reviews)

Resources that have been written by an experienced science teacher and delivered to real classrooms full of real students. All students are different and all teaching styles are different - what suits you may not suit another so feel free to adapt and change the resources to make them fit your style. I work in a school where money is tight so it is necessary to use a good deal of imagination.

Resources that have been written by an experienced science teacher and delivered to real classrooms full of real students. All students are different and all teaching styles are different - what suits you may not suit another so feel free to adapt and change the resources to make them fit your style. I work in a school where money is tight so it is necessary to use a good deal of imagination.
nth term heavily scaffolded
chemladdiechemladdie

nth term heavily scaffolded

(0)
nth term for lower ability or fresh introduction. Lots of space on each slide to show working on a projector. This constitutes two lessons with worked examples and with an assessment activity at the end. Answers included. Print to A4 or A3. Some students find the nth term difficult. These slides take a step by step approach that begins with use of simple times tables. Later slides have combination nth terms. Print the assessment activity on A3 and you can get real data on progress.
percentage increase and decrease
chemladdiechemladdie

percentage increase and decrease

(0)
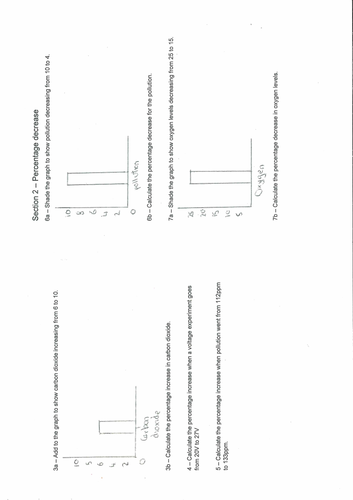
This has 2 short sections: 1 - percentage increase; and, 2 - percentage decrease. The sheet is designed so that students graphically shade in the increase or decrease on a bar graph. Then do some basic percentage calculations. The sheets will print as an A5 booklet that will easily be inserted into a workbook. On screen, they are two A4 sheets - take them to a printer and select the A5 booklet option. This has been used with students that are just learning about percentage increase/decrease or with lower attaining older students. Being able to see the change on the shaded section on a bar chart really helps students to see what is happening. Use it as a quick ‘in lesson’ worksheet; it makes a good plenary activity or use it as a learning check following some teacher feedback.