37Uploads
30k+Views
40k+Downloads
All resources

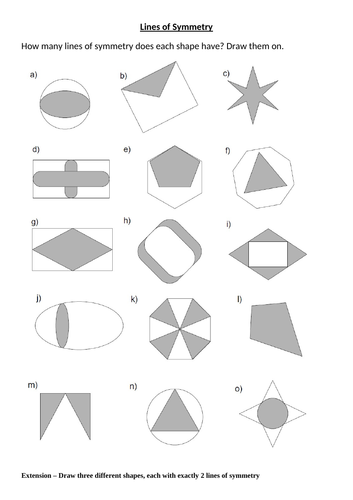
Symmetry of 2D shapes
The first lesson is all about lines of symmetry. The second part is about order of rotations. You will need tracing paper.

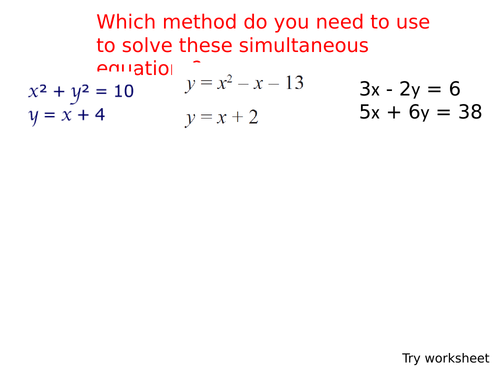
Solving simultaneous equations including quadratics revision
Solving simultaneous equations including quadratics revision

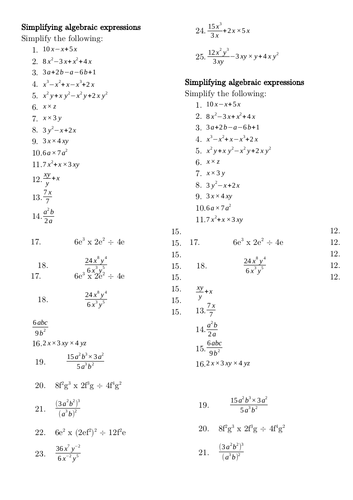
Simplifying and solving equations with fractions
Simplifying and solving equations with fractions - answers included

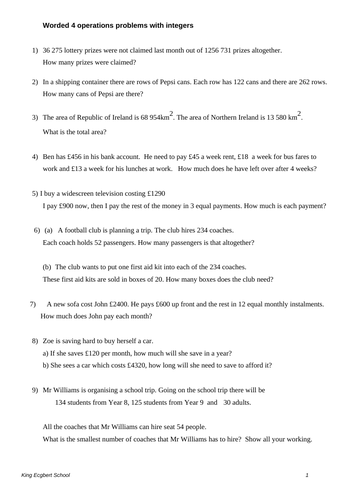
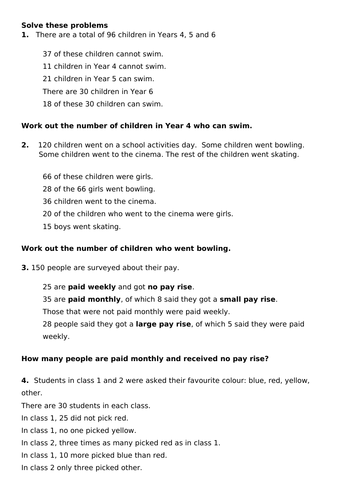
Worded 4 operations problems with integers medium difficultly with answers
Designed for it be done without a calculator.

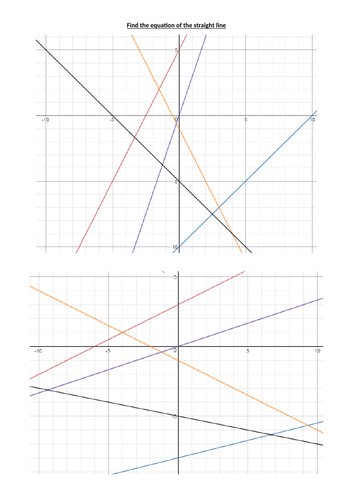
Linear graph properties
Aimed a high ability students. Includes plotting linear graphs, using y=mx+c, finding midpoints, parallel and perpendicular lines.

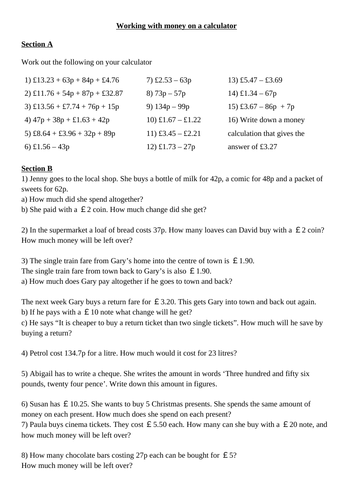
Money problems on a calculator
Part 1 - using you calculator when you are dealing with money.
Part 2 - questions in context.
Answers included.

Two way tables - making them to solve problems
Suggestion - start by letting pupils have a go at the first question before mentioning a two way table.

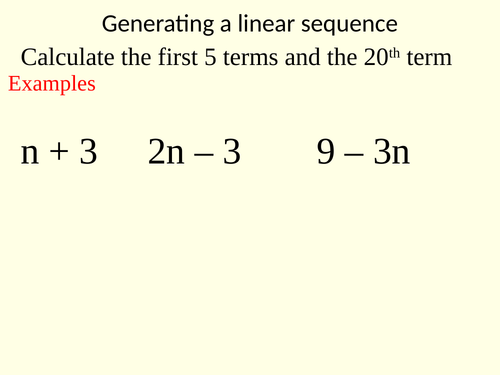
Nth term - generating a sequence and finding the nth term of a linear sequence
Nth term - generating a sequence and finding the nth term of a linear sequence. Aimed at middle/high ability.

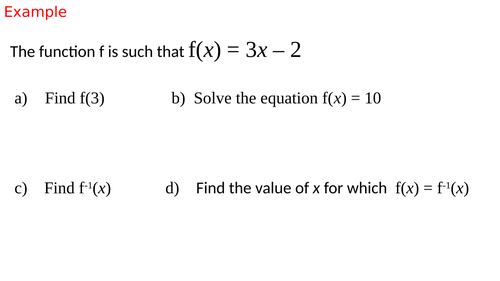
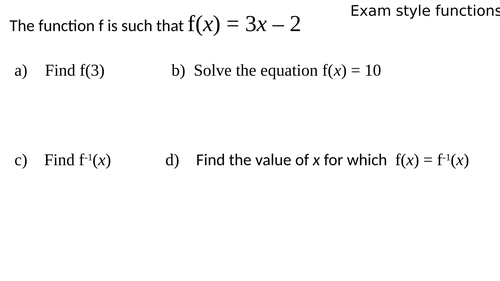
Mixed functions GCSE
I used this at the end of a series of lessons on simple functions, inverse functions and composite functions.

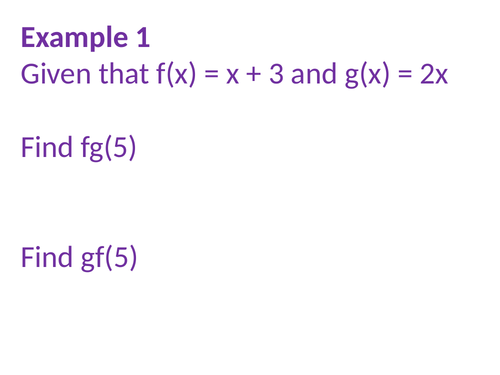
Composite functions
The first part involves substituting in numbers the second part is expressions including quadratics.

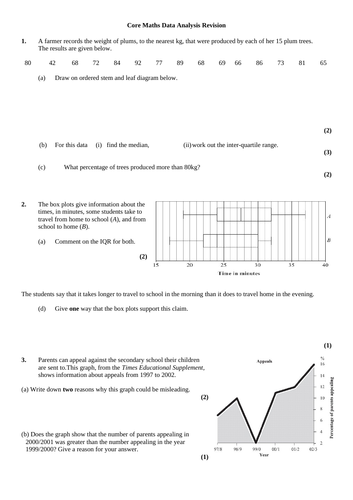
Core Maths Data Analysis Revision
Core Maths Data Analysis Revision - I have not used this yet so there are no answers.

Cumulative frequency and box plots
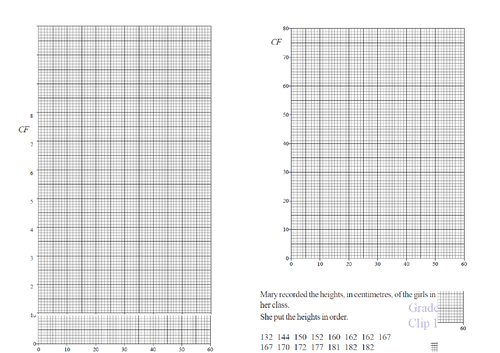
1 or 2 lessons on drawing cumulative frequency and box plots including medians and interquartile ranges. The worksheet has blank graphs that match up with the data.

