Hello!
I am the Head of Physics at a Comprehensive Secondary School in Basingstoke. I am also the Head of BTEC Science, a Teaching and Learning Coach and Assistant G&T Co-ordinator.
I believe students learn in many ways and incorporate many learning styles in my teaching.
I love being able to enthuse and inspire my students every day and as a result I enjoy consistent outstanding lessson observations and exam success!
I believe I have the best job in the world, even on the toughest days...!
This is for three resources. A PowerPoint presentation covering how biofuel and nuclear power stations work and how they generate electrical energy. Questions and answers contained. A summarisation activity follows.
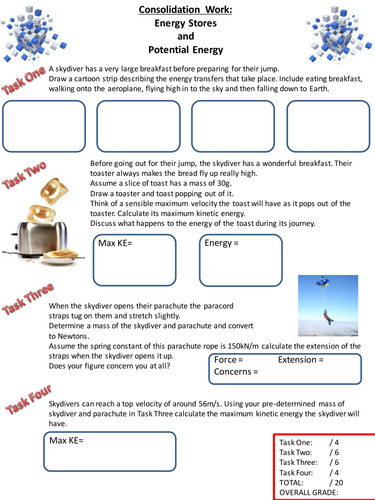
This is for a set of consolidation activities that are designed to each take on whole lesson. They could be used as homewwork tasks too if time is short but I prefer to use them as lessons.
They consolidate knowledge about:
1. Energy and Potentials
2. GPE and Work
3. Power and Specific Heat Capacity
4. Reducing nwanted and Energy and Conservation of Energy and Power
5. Efficiency and Energy Resource Use
6.Wind, Solar, Geothermal, Hydro, Waves and Tidal Power Stations
7.Bio and Nuclear Energy and Energy Trends
Each has a theme and a box to put a score and grade in.
This set comprises of eight PowerPoints covering the difficult parts of P6. I used and will continue to use this year these PowerPoints until the change over. Lots of questions and answers within with very clear explanations and diagrams. Include differentiated lesson objectives as expected.
Diode and Half Way Rectification
Full Wave Rectification
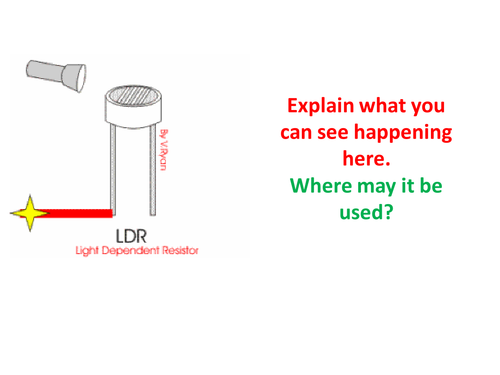
LDR, Thermistors and Potential Dividers
Logic Gates
Potential Dividers
How to Reduce Heat in Transmission Lines
Resistance - Ohmic or Non-Ohmic
Transistors
This is an excel data generator that asks you to very simply add numbers in for comments. It then generates comments and advises on which extra homework to do to master a task. Two to an A4 side are then ready for printing.
A PowerPoint guide to how to use this is included.
Included are 12 extra homework tasks (designed to be about 15 minutes of work) that match up with comments made. These tailor each student's needs.
I have been using this (on the old OCR Gateway spec) and have found book marking to be much easier. It provides personalised comments and tailored tasks to meet student's specific needs. Students have found this to be very handy as they are able to see where they need to improve at a glance. Parents enjoyed being able to use it in a similar fashion.
This is for 20 APP resources that cover areas about investigations, plotting graphs, analysing data and risk assessing.
They cover Year 7, Year 8 and Year 9. They are all practical based activities (either experiment or using data) and they each take a whole lesson.
Print them out on A3 yellow paper so you can easily locate them in student's books.
Each APP task is write in boxes on one side. Other side is success criteria, teacher and student somment boxes. Very easy to mark, just highlight the criteria students attained.
Year 7:
Graph Drawing Sycamore Seeds
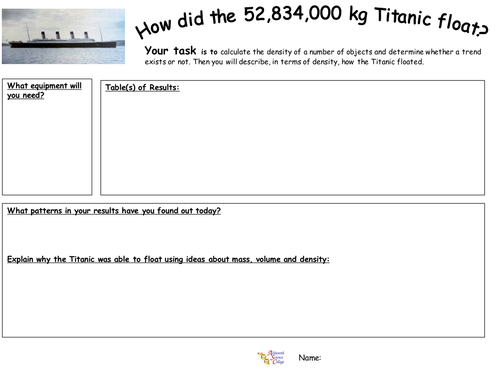
Trends and Patterns Titanic Density
Risk Assessment of Neutralisation
Plan Separation Techniques
Secindary Sources for Frictional Forces
Tabulating Data of Light Intensity
Year 8:
Why do People Smoke SMSC
How Much Fat Is In a Crisp Tabulate Data
What's So Special About Alkali Metals Trends and Patterns
Burning Magnesium Data Analysis
Electromagnets Drawing Graphs
Streamlining with Plasticine Evaluation of Procedure
Year 9:
Should Cannabis be Legalised Application of Data
Holly Leaves and Prickles Interpreting Trends
Rates of Reaction Evaluating Procedure
How Do You Make A Salt PLan an Investigation
What Crushed My Can Explaining Evidence
Resistance Of A Wire Presenting Data
Quadrats gathering Information
Salol Risk Assessment
I designed these so they could be used to prepare students for the skills needed at GCSE. Our department made them a priority.