83Uploads
9k+Views
5k+Downloads
All resources

Cash Flow Forecast Activity
Test your students’ knowledge of cash flow forecasts with this UNIQUE activity that demonstrates if students can calculate each of the different values.
This cash flow forecast contains a number of intentional errors that students need to identify and correct.
All instructions are included in the activity, but the key thing to note is that all yellow values cannot change, any others can.
Included in this activity are the following:
Page 1 - Instructions on how to complete the activity, a cash flow forecast (in colour) and an explanation of what the first error is and how it should have been calculated.
Page 2 - All errors have been circled. This can be shown after the cash flow forecast has been completed.
Pages 2 and 3 - Detailed explanations of all errors and how they should have been calculated.
Page 4 - The completed cash flow forecast with all answers.
How I run the activity:
Give students up to 10 minutes to complete the cash flow forecast
Once finished, ask students to explain any errors they have found (this took my class 10 minutes)
Show the circled errors on the board so that students can circle them
Explain each error in detail
Show the completed cash flow forecast on page 3 and get students to mark them. This will save you time.

Allocative Efficiency (Economics)
Arguably the trickiest of the efficiencies students need to understand.
This presentation has been designed to break this efficiency down and explain it step by step.
Productive and dynamic efficiency also recapped in a starter activity.
Lots of activities included in the presentation.
Last few slides go through exam technique for 8-markers (Edexcel) with a sample question and model answer

Exam Stress Assembly: The Hidden Superpowers of Orange Paper
This assembly has been created to help students with suggested tools to help them during stressful periods, such as exams.
Students often don’t engage on advice on coping with exam stress so this assembly has been created to approach it at a different angle and to be as creating, colourful and engaging as possible.
GIFs and animations have been used throughout
‘Notes’ have also been included in each slide to give suggested prompts of what to say for each slide
The focus of the assembly is the emotional side of learning and how specific emotions affect learning more than others.
It also includes some interesting, quirky but quick and simple techniques on managing these emotions.
There are 16 slides in total and has been designed to take 15 minutes to go through (the allocated time frame for my assemblies)

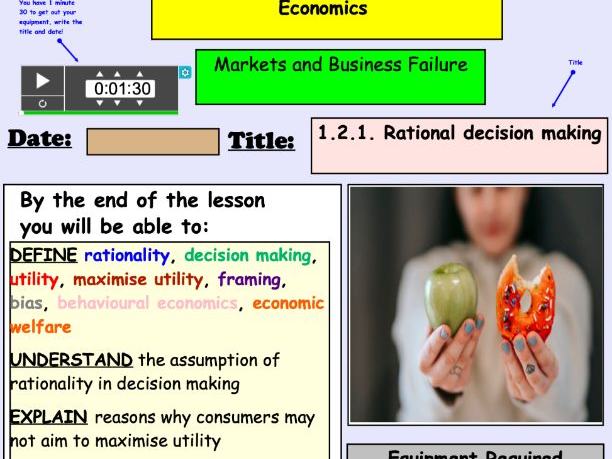
Rational Decision Making
This resource is a 17 slide PowerPoint that explains the concept or rational decision making.
Included in the presentation:
A colourful and informative title slide that outlines the learning objectives
An engaging and interactive online ‘vortex’ starter activity. Students need to match which key term links with which of four topics. Activity is self marked and instructions are included
Explanations of how rational decision making is a principle of neo-classical economics
Contextualised examples of how customers don’t always act rationally (Nudge Theory, Third Decoy, Dopamine, FOMO)
Explanation as to why consumers may not act rationally
This resource took me 30 minutes to complete

Free, Mixed and Command Economies
The PowerPoint attached is an informative presentation that explains the difference between command, mixed and free market economies.
Contextualised exams provided throughout.
This presentation contains 18 slides and took me 30 minutes to go through

Average Rate of Return
Included in this lesson:
A detailed and colourful title slide, including all learning objectives for this topic
A recap starter activity on calculating the payback period (answers included)
An explanation slide as to what the lesson is about; providing an overview of the problems of relying solely on the payback period as a method of investment appraisal and why other methods are also needed
Explanation of what ARR is
A scenario showing how ARR is calculated
An evaluation of ARR
There are 22 slides in total and it took me around 30 minutes to go through the presentation.

Critical Path Analysis Worksheet
A detailed worksheet with a range of explanations and activities on critical path analysis and completing network diagrams. There are eight activities included, spread over 5 tasks, ranging from step by step guidance as to how the diagram is completed, to float times and identifying the critical path.
I’ve tried to make it as easy as possible for students and teachers to follow.
All answers have been included at the back. Save yourself some marking and give the answers for students to peer mark if you wish!

Introduction to Marketing
This is an introductory lesson as to what marketing is. Although this resource has been created with the Eduqas exam board in mind, it can actually be used or edited to any exam board.
The lesson contains a number of activities, notes, explanations.
This lesson took me an hour to go through with my students.

Economics as a Social Science (Lesson + Worksheet)
This PowerPoint presentation and worksheet has designed based on the Edexcel A Level Specification but can be applied to any exam board.
The PowerPoint includes:
Detailed and colourful title page with animations, auto calendar date, gifs and timer
Starter activity that test students’ understanding of economic terminology they should be familiar with in the news
Detailed explanation of what economics is
Challenging assumption activity
Detail notes
All answers included
The worksheet has 4 activities:
Match important key terms relating to this lesson
Challenge the assumption activity
Micro or macro scenario
UK economy trivia

Business Ownership
An 89 slide, detailed PowerPoint presentation on forms of business ownership. This presentation goes into detail about:
The public sector
The private sector
Soletraders
Partnerships
Limited Companies
Not-for-profit organisations
This presentation includes a number of editable recap activities (decision tree, guess the question, etc)
Colourful, interactive with animations throughout.
This presentation took me 3 hours to complete with my students

Maslow's Hierarchy of Needs
PowerPoint resource on Maslow’s Hierarchy of Needs includes:
Colourful and interactive title page with animations and timer
Catchphrase starter activity (with answers)
Detailed notes on Maslow’s Hierarchy of Needs, each individual need and how they are achieved
Trivia activities between each need
Exam skills practice activity (with answers)

Maslow's Hierarchy of Needs
Full resource (68 slides) on Maslow’s hierarchy of needs.
Included in this resource:
Colourful and interactive title page , including timer and auto date
Catchphrase starter activity (with answers)
Step by step explanation of each need in the hierarchy
Contextualised examples
Trivia activity
Exam skills activity with answers

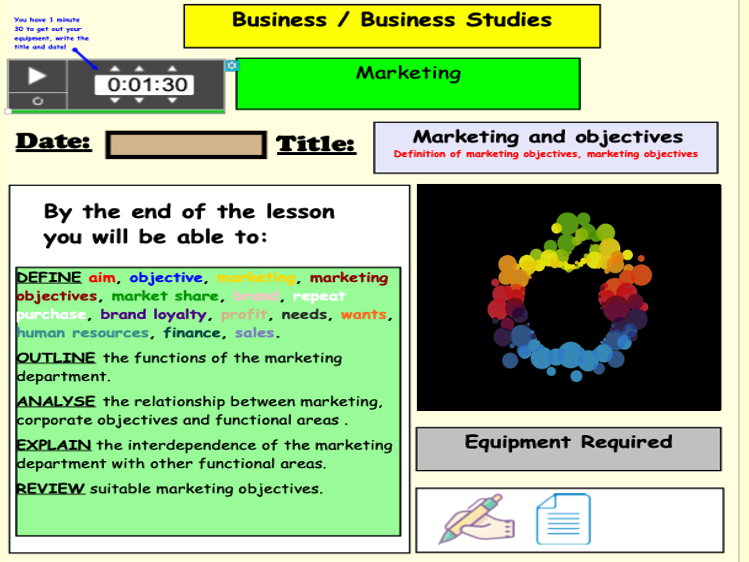
Marketing Objectives
A colourful and engaging resource on Marketing Objectives.
Included in this presentation;
A colourful and informative title slide outlining learning objectives. This slide includes animations
A Catchphrase starter activity where students guess the name of a business or product fro a range of picture clues
A recap fill the blanks starter activity that tests what student have learned about marketing so far (PowerPoint slide can be printed for students and answer key included)
Explanation of aims, objectives and mission statements
Match the mission statement activity
Detailed and contextualised notes on marketing strategy, SMART objectives
There are 35 slides in total and this lesson took me an hour to complete

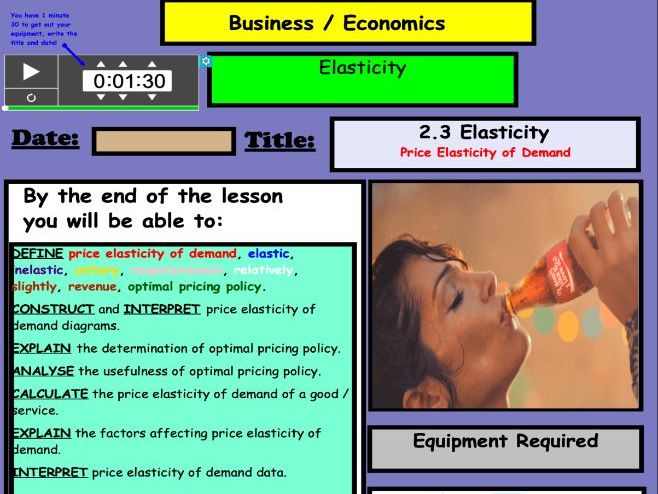
Price Elasticity of Demand
Colourful. Engaging. Informative. This PowerPoint has been creating to introduce students to the concept of price elasticity of demand.
Included in this PowerPoint:
A detailed and colourful title page, highlighting the skills that will be covered over the duration of this topic
A starter activity where students need to rank in order which goods / services would be most to least affected by a change in price
Discussion points
Slides detailing how price elasticity of demand is calculated, with an example
Slides explaining what the numerical values mean (how to interpret them)
Calculation questions with answers
Explanation of the factors affecting price elasticity of demand
This resource took me one hour to go through as a class

Depreciation (Business / Business Studies)
Description
A COLOURFUL, INFORMATIVE and ENGAGING presentation that on depreciation.
Included in this lesson:
A colourful and informative title slide that outlines the key skills covered in this topic, a list of equipment required, animated gif to grab the attention of students, and timing ‘prompt’ to get students to get the title down and equipment out as quickly as possible
A ‘guess the question’ starter activity where students are given the answers to ten questions relating to other Accounts / Finance related topics. Students need to work out what the ten questions were to get those answers. Answers are included in the presentation
An explanation of what the lesson aims are
An explanation of what assets are, contextualised to students
Informative, colourful and contextualised slides explaining what current and non-current assets, and depreciation are
A step by step guide to show how depreciation is calculated using the straight-line method, followed by an example for students to calculate (answers provided)
An explanation of the advantages and disadvantages of using the straight-line method to calculate depreciation
The same step by step guide, advantages and disadvantages for the reducing balance method
An exam style question where students need to calculate the value of depreciation, calculate how this affects the estimated value of an asset and when the right time to sell an asset it. Answers provided in the presentation with explanations
I’ve designed this lesson so that it can simply be opened and taught immediately. Each slide is self explanatory and easy to follow. There are 38 slides included in this lesson and it took me just under 2 hours to go through.

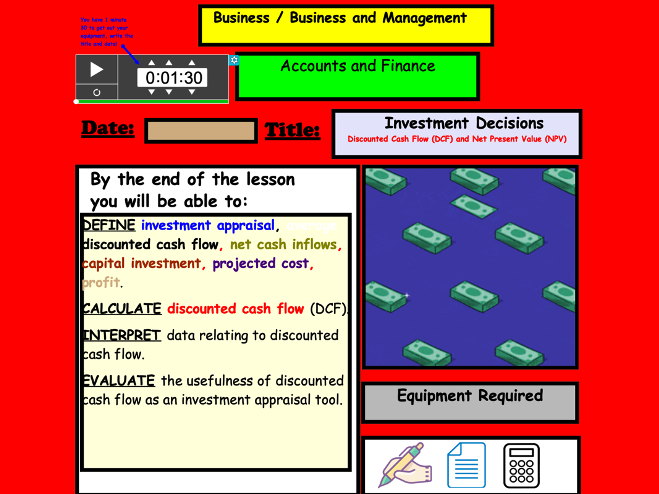
Net Present Value
Net Present Value is a topic that students often find challenging. This presentation has been produced so that students of all abilities can access the topic. Using lots of colour and engaging slides, contextualised examples as well as step by step examples, this presentation has proven to be very successful in getting my students to understand this net present value effectively.
Included in this presentation:
A detailed title slide including key skills covered in the lesson and equipment required
Initial starter activity where students need to calculate the payback period and average (accounting) rate of return. The aim of this activity is to get students to think about how using both of these methods can provide conflicting results (one investment option could have a shorter payback period where the other could have a higher average rate of return). Activity and answers included in slide, as well as explanation of how these figures were calculated.
Step by step guidance as to what the net present value and time value of money means (we look at why it is better to have £100 now rather than next year)
Activities that explain what inflation and interest rates are, and how they affect the value of money (guess the price activity can be done on mini whiteboards or completed as a class)
Step by step guide demonstrating how net present value is calculated
An explanation of how net present value can be applied to investment decisions
An evaluation of the usefulness of net present value, with examples provided.
This presentation contains 53 slides and took me just under 2 hours to go through in detail.

Demand and the Demand Curve
A PowerPoint presentation on demand includes:
Catchphrase starter activity
Demand activity (graph paper required)
Detailed explanations of demand, reasons for shape of demand curve, movements, shifts, ceteris paribus
This lesson took me 60 minutes to go through

Market Research
Colourful and interactive lesson on market research (primary and secondary).
The lesson is split into 3 parts. 2 lessons were spent on primary research, the third spent on secondary research.
Each part of the lesson contains a different starter activity (3 starter activities in total, with answers), including fill the blanks< Catchphrase and editable key term challenge.
PowerPoint contains videos, animations and a Mentimeter activity (you will have to have your own account to access this activity)
All activities are optional and most are editable.
77 slides in total and took me two hours to go through with my students.

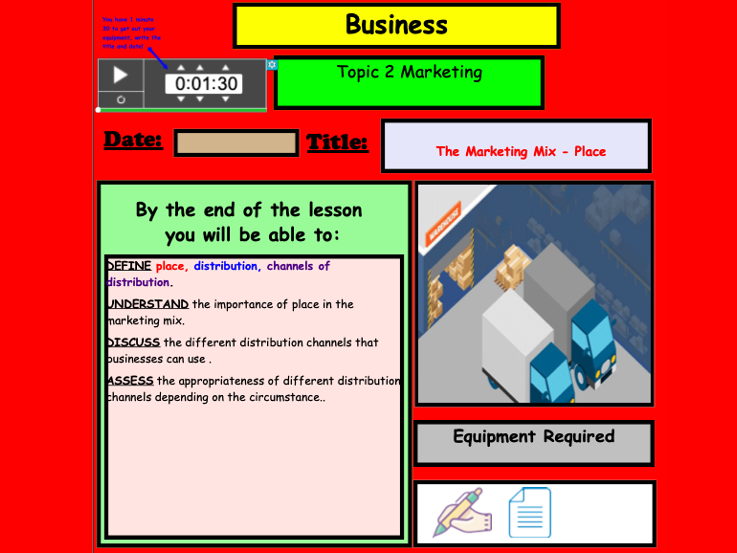
Marketing Mix - Place
Included in this presentation:
A fun Catchphrase starter activity (my students love this!)
A recap activity on cost-based pricing strategies with answers (feel free to remove or skip if you are you to cover this)
Notes and examples on the different methods of distribution
Notes on the pros and cons of each method of distribution
Notes on the importance of selecting the most appropriate method of distribution


