I'm an A-Level physics teacher. In my opinion independent learning is the key to success so I focus a lot of effort into making resources to help students learn physics independently. A lot of what I make is available for free on YouTube. My website has links to everything.
I'm starting to offer my free downloads on https://wonkylogic.co/a-level-physics-hq which does not require a log in to download.
A Keynote¹ presentation for introducing students to handling experimental uncertainties in science measurements. Topics covered are: types of error (systematic and random), absolute and percentage uncertainty, and rules for determining uncertainty in calculated values (five calculation rules in total).
There is also a sample of exam questions - three for each rule (except rule 1 which has just one exam question).
Also included in addition to the above:
An explanation of uncertainty in handheld stopwatches.
Examples - notably an example question with full worked solution for each calculation rule.
There is a lite version of this slideshow available for free so you can get a feel for the resource prior to purchasing this slideshow if you would like to do so. Note that the Lite version does not contain all of the teaching content of this presentation; the rules for multiplication by coefficients and calculation with complex functions (trig and logs) are only available in this version.
¹ Keynote works on iPhones, iPads, Macs and in many web browsers. Check your device against Apple’s latest guidance.
A Keynote¹ presentation for introducing students to handling the most common experimental uncertainties in science measurements (addition/subtraction, multiplication/division and indices). Topics covered are: types of error (systematic and random), absolute and percentage uncertainty, and rules for determining uncertainty in calculated values. There is a sample of three exam questions - one for each rule.
The full version of the slideshow has in addition to the above:
All five uncertainty calculation rules – multiplication by coefficients and calculation with complex functions (trig and logs).
An explanation of uncertainty in handheld stopwatches.
More examples - notably an example question with full worked solution for each calculation rule.
More exam questions - a total of three questions per rule.
¹ Keynote works on iPhones, iPads, Macs and in many web browsers. Check your device against Apple’s latest guidance.
A range of worksheets to help physics students develop essential graph skills including plotting graphs, drawing lines of best fit, calculating gradients and intercepts, analysing graphs by comparing equations to y=mx+c, analysing log graphs, drawing curves of best fit, taking tangents, and calculating intercepts for graphs with false origins.
This bundle constitutes 10% off buying all paid worksheets individually.
A spreadsheet that can be used to analyse the data obtained in the experiment to investigate light intensity and distance like in this video.
The spreadsheet automatically calculates the power of the light source and percentage difference with the manufacturer’s rating from inputted distance and light intensity data. The data plots are added to a carefully formatted graph. A line of best fit is automatically plotted. The gradient of the line is automatically calculated from the data plots and the value of the source power is calculated by using the gradient. This spreadsheet is perfect for rapidly analysing experimental data.
A second table calculates proportionality constants so that the user can very quickly check if their data obeys an inverse square law.
This is a Numbers spreadsheet. It is possible to convert Numbers spreadsheets to Excel files but I cannot guarantee an easy to use output since the tables may be converted to separate worksheets in the Excel file.
A worksheet to enable students to analyse experimental data from the experiment to investigate light intensity and distance. I’ve made a video of the experiment here youtu.be/TpSghS5Hzsw. The data collected in the video can be used to complete a table, plot a graph and answer a series of analysis questions in order to determine the power of the light source.
There are links from the PDF directly to the relevant part of the data collection in the video for anyone using the worksheet electronically. There are solutions at the end.
Perfect for A-level physics students on any specification.
This worksheet is ideal for home learning since it has an accompanying video explanation of the experiment, the analysis of results and solutions to all questions are included in the document.
This spreadsheet will solve your problems involving the equations of uniform acceleration. If you’re a physics teacher you’ll need to solve a lot of these problems at certain times of the year, you may even need to invent your own questions. This may speed up your workflows. Simply input your data (s u v a and t) typing a question mark by the unknown quantity. Then select the equation you need to use from a drop down menu and the answer is calculated.
Calculations are performed on a background table, so at any time you can investigate what’s happening on that tab. Questions that lead to two values of t (due to the square root in some solutions) are solved and both values of t are shown.
A spreadsheet that can be used to analyse the data obtained in the experiment to determine the decay constant of an isotope like in this video.
The spreadsheet automatically calculates the decay constant and initial activity from inputted time and activity readings using a natural log analysis. The data plots are added to a carefully formatted graph. A line of best fit is automatically plotted. The gradient and y-intercept of the line are automatically calculated from the data plots and the value of the decay constant is calculated by using the gradient. This spreadsheet is perfect for rapidly analysing experimental data.
The initial activity is calculated by using the y-intercept, this is a useful indicator of the accuracy of the final value.
This is a Numbers spreadsheet. It is possible to convert Numbers spreadsheets to Excel files but I cannot guarantee an easy to use output since the tables may be converted to separate worksheets in the Excel file.
Suitable for most physics specifications that cover nuclear physics.
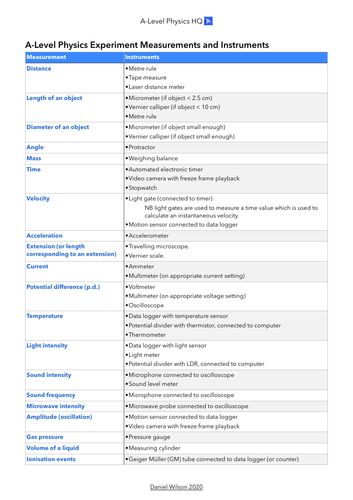
A reference table to help students memorise measurements that occur in a wide range of physics practical work and the associated measuring instruments.
Most exam series include questions on designing an experiment, a key part of which is to state the measurements to take and the instruments to use.
Live up your Google Classroom with two animated banners (GIFs) for Google Classroom. One shows an elastic collision between different sized pucks. The other shows an inelastic collision between different sized pucks.
ψ Art by Wonky Logic
Activity for practicing calculation of y-intercepts for graphs with a false origin. This worksheet includes five graphs with lines of best fit already plotted. A student needs to draw the gradient triangle, determine the gradient and then use y = mx + c to determine the value of the intercept. Pages with solutions for all graphs are included in the document.
The graphs cover a range of topic areas in physics (free-fall, Hooke’s Law, wave intensity, mass-spring oscillation and capacitor discharge). But since a student only needs to determine values for the gradient and intercept students do not need to be familiar with the topic in order to tackle the tasks.
Suitable for AQA and OCR Physics A AS-Level and A-Level specifications.
(7407, 7408, H156, H556)
This worksheet is great for home learning since it has solutions to all questions included in the document and it is part of a series that gradually builds up a range of graphing techniques.
A Keynote presentation to aid teaching students how to use Vernier Calipers and Micrometers. Learning how to use vernier calipers and micrometers is an important part of physics A-Level, and engineering courses.
The presentation includes a labelled diagram of a vernier caliper, followed by two high quality diagrams of vernier calipers showing different measurements. The process is repeated with a labelled diagram of a micrometer and diagrams of a micrometer showing different measurements.
Keynote is presentation software that works on macOS, iOS and iPadOS devices. The worksheet is a PDF.
**There is a premium version of this activity available as a presentation with an accompanying worksheet. ** Each device has four different measurements in that version. The measurements shown in the premium version are different to this activity so if you decide to buy the premium version you can easily increase the number of measurements you work through with your students by copying them across.
A Keynote¹ and PowerPoint presentation to aid teaching students how to use Vernier Calipers and Micrometers with accompanying printable worksheet. Learning how to use vernier calipers and micrometers is an important part of physics A-Level, and engineering courses.
The presentation includes a labelled diagram of a vernier caliper, followed by high quality diagrams of vernier calipers showing different measurements. The diagrams match those on the worksheet so that students can work through each measurement individually on the worksheet in the first instance.
The process is repeated with a labelled diagram of a micrometer and diagrams of a micrometer showing different measurements. The worksheet has all diagrams of vernier calipers and micrometers on a single side of A4 paper.
¹ Keynote is presentation software that works on macOS, iOS and iPadOS devices. The worksheet is a PDF. A PowerPoint version is included for users requiring it.
There is a free version of this activity available as a presentation only (no worksheet) and fewer measurements (two of each). The measurements shown in the free version are different to this activity so if you want to increase the number of measurements you work through with your students you can copy them across.
A Keynote presentation to help teach your students how to present science experiment results in tables and graphs. The presentation includes a good table and graph with animated bullet points to draw attention to the good features.
A premium version of this activity is available with a worksheet and with an annotated erroneous table/graph:
>> The premium presentation includes a table and graph with errors that the students try to identify - they can annotate the accompanying worksheet. Each error is identified with animated annotations in the presentation.
Keynote is presentation software for macOS, iPadOS and iOS
A Keynote presentation with worksheet to help teach your students how to present science experiment results in tables and graphs. The presentation includes a table and graph with errors that the students try to identify - they can annotate the accompanying worksheet. Each error is identified with animated annotations in the presentation.
A good table / graph is then shown to illustrate the good features. The worksheet includes the good table and graph for optional sharing with students after the activity.
A free version of this activity is available without the worksheet and without the annotated erroneous table/graph.
Keynote is presentation software for macOS, iPadOS and iOS
Copy of the spreadsheet I used to analyse the data obtained in the experiment to determine the capacitance of a capacitor in this video.
The spreadsheet automatically calculates capacitance from inputted time and potential difference readings using a natural log analysis. The data plots are added to a carefully formatted graph. A line of best fit is automatically plotted. The gradient and y-intercept of the line are automatically calculated from the data plots and the value of the capacitance is calculated from the gradient. This spreadsheet is perfect for rapidly analysing experimental data.
A second method of analysis is also possible using a second graph - a direct plot of p.d. versus time (exponential data). Instructions are included to guide the user in determining the value of the time constant and that is then used to calculate a value of C that can be compared with the first method.
This is a Numbers spreadsheet. It is possible to convert Numbers spreadsheets to Excel files but I cannot guarantee an easy to use output since the tables may be converted to separate worksheets in the Excel file.
Suitable for most physics specifications.
Take your Google Classroom to the next level with a cool science-themed animated banner!
Eight planets of the solar system orbit the Sun. Orbit timings are not to scale - this is just for fun! You’ll need to download it before you see the animation.
An I ♥ Science Resource by Wonky Logic
A worksheet to enable students to analyse experimental data from the experiment to determine the capacitance of a capacitor by discharging it through a known resistance. I’ve made a video of the experiment here youtu.be/IQQ6XWTBYmY . The data collected in the video can be used to complete a table of potential difference values, calculate natural log of V, plot a graph and answer a series of analysis questions in order to determine the unknown capacitance. A second method of analysis is also covered which entails using the time constant of the circuit to determine a value of C.
There are links from the PDF directly to the relevant part of the data collection in the video for anyone using the worksheet electronically. There are solutions at the end.
Perfect for physics students on just about any specification.
This worksheet is ideal for home learning since it has an accompanying video explanation of the experiment, the analysis of results and solutions to all questions are included in the document.
Copy of the spreadsheet I used to analyse the experiment to determine the acceleration of free fall in this video.
The spreadsheet automatically calculates final velocity of the weighted card from inputted electronic timer readings. The data plots are added to a carefully formatted graph. A line of best fit is automatically plotted. The gradient and y-intercept of the line are automatically calculated from the data plots and the value of acceleration of free fall is calculated from the gradient. This spreadsheet is perfect for rapidly analysing experimental data.
This is a Numbers spreadsheet. It is possible to convert Numbers spreadsheets to Excel files but I cannot guarantee an easy to use output since the tables may be converted to separate worksheets in the Excel file.
Suitable for most A-Level Physics specifications.
A worksheet to enable students to analyse experimental data from the experiment to determine the acceleration of free fall with a light gate. I’ve made a video of the experiment here youtu.be/yKVjlnSOu7s (available from 20 Aug). The data collected in the video can be used to complete a table, plot a graph and answer a series of analysis questions in order to determine the acceleration of free fall.
There are links from the PDF directly to the relevant part of the data collection in the video for anyone using the worksheet electronically. There are solutions at the end.
Perfect for A-level physics students on any specification.
This worksheet is ideal for home learning since it has an accompanying video explanation of the experiment, the analysis of results and solutions to all questions are included in the document.
A detailed presentation to aid explanation of the role of radiation intensity in the photoelectric effect for various photon frequencies relative to the threshold frequency of the metal. Students often misunderstand the inability of increased intensity to trigger the photoelectric effect and therefore believe it has no role. This presentation is a visual aid to help the teacher show that it has a role in controlling the number of photons arriving per unit time.
This presentation compares low and high intensity sources of red and green light with low and high intensity blue light (where green and blue light have frequencies above the threshold frequency). The effect of intensity on the number of photons arriving at the metal is made clear and intensity is clearly distinguished from photon energy.
This is a Keynote presentation (macOS, iPadOS and iOS).
Useful for all A-Level physics specifications.
The photoelectric effect is an important experiment in physics that proves that light behaves like a particle, it was a founding experiment for quantum theory. Einstein won his Nobel prize for his work on explaining the photoelectric effect.