I'm an A-Level physics teacher. In my opinion independent learning is the key to success so I focus a lot of effort into making resources to help students learn physics independently. A lot of what I make is available for free on YouTube. My website has links to everything.
I'm starting to offer my free downloads on https://wonkylogic.co/a-level-physics-hq which does not require a log in to download.
A spreadsheet that can be used to analyse the data obtained in the experiment to investigate light intensity and distance like in this video.
The spreadsheet automatically calculates the power of the light source and percentage difference with the manufacturer’s rating from inputted distance and light intensity data. The data plots are added to a carefully formatted graph. A line of best fit is automatically plotted. The gradient of the line is automatically calculated from the data plots and the value of the source power is calculated by using the gradient. This spreadsheet is perfect for rapidly analysing experimental data.
A second table calculates proportionality constants so that the user can very quickly check if their data obeys an inverse square law.
This is a Numbers spreadsheet. It is possible to convert Numbers spreadsheets to Excel files but I cannot guarantee an easy to use output since the tables may be converted to separate worksheets in the Excel file.
A worksheet to enable students to analyse experimental data from the experiment to determine the acceleration of free fall with a light gate. I’ve made a video of the experiment here youtu.be/yKVjlnSOu7s (available from 20 Aug). The data collected in the video can be used to complete a table, plot a graph and answer a series of analysis questions in order to determine the acceleration of free fall.
There are links from the PDF directly to the relevant part of the data collection in the video for anyone using the worksheet electronically. There are solutions at the end.
Perfect for A-level physics students on any specification.
This worksheet is ideal for home learning since it has an accompanying video explanation of the experiment, the analysis of results and solutions to all questions are included in the document.
Copy of the spreadsheet I used to analyse the experiment to determine the acceleration of free fall in this video.
The spreadsheet automatically calculates final velocity of the weighted card from inputted electronic timer readings. The data plots are added to a carefully formatted graph. A line of best fit is automatically plotted. The gradient and y-intercept of the line are automatically calculated from the data plots and the value of acceleration of free fall is calculated from the gradient. This spreadsheet is perfect for rapidly analysing experimental data.
This is a Numbers spreadsheet. It is possible to convert Numbers spreadsheets to Excel files but I cannot guarantee an easy to use output since the tables may be converted to separate worksheets in the Excel file.
Suitable for most A-Level Physics specifications.
A spreadsheet that can be used to analyse the data obtained in the experiment to determine the decay constant of an isotope like in this video.
The spreadsheet automatically calculates the decay constant and initial activity from inputted time and activity readings using a natural log analysis. The data plots are added to a carefully formatted graph. A line of best fit is automatically plotted. The gradient and y-intercept of the line are automatically calculated from the data plots and the value of the decay constant is calculated by using the gradient. This spreadsheet is perfect for rapidly analysing experimental data.
The initial activity is calculated by using the y-intercept, this is a useful indicator of the accuracy of the final value.
This is a Numbers spreadsheet. It is possible to convert Numbers spreadsheets to Excel files but I cannot guarantee an easy to use output since the tables may be converted to separate worksheets in the Excel file.
Suitable for most physics specifications that cover nuclear physics.
Copy of the spreadsheet I used to analyse the resistivity experiment in this video.
This is a Numbers spreadsheet. It is possible to convert Numbers spreadsheets to Excel files but I cannot guarantee an easy to use output since the tables may be converted to separate worksheets in the Excel file.
A worksheet to enable students to analyse experimental data from the experiment to investigate light intensity and distance. I’ve made a video of the experiment here youtu.be/TpSghS5Hzsw. The data collected in the video can be used to complete a table, plot a graph and answer a series of analysis questions in order to determine the power of the light source.
There are links from the PDF directly to the relevant part of the data collection in the video for anyone using the worksheet electronically. There are solutions at the end.
Perfect for A-level physics students on any specification.
This worksheet is ideal for home learning since it has an accompanying video explanation of the experiment, the analysis of results and solutions to all questions are included in the document.
A spreadsheet that can be used to analyse the data obtained in the experiment to investigate the transformers turns ratio equation like in this video.
The spreadsheet automatically calculates the turns ratios and potential difference ratios from the inputted turns and p.d. values. The calculated ratios are added to two carefully formatted graphs - a column chart and a line graph. A line of best fit is automatically plotted. The linear correlation of the line is automatically calculated from the line graph. This spreadsheet is perfect for rapidly analysing experimental data.
This is a Numbers spreadsheet. It is possible to convert Numbers spreadsheets to Excel files but I cannot guarantee an easy to use output since the tables may be converted to separate worksheets in the Excel file.
A Keynote¹ presentation for introducing students to handling the most common experimental uncertainties in science measurements (addition/subtraction, multiplication/division and indices). Topics covered are: types of error (systematic and random), absolute and percentage uncertainty, and rules for determining uncertainty in calculated values. There is a sample of three exam questions - one for each rule.
The full version of the slideshow has in addition to the above:
All five uncertainty calculation rules – multiplication by coefficients and calculation with complex functions (trig and logs).
An explanation of uncertainty in handheld stopwatches.
More examples - notably an example question with full worked solution for each calculation rule.
More exam questions - a total of three questions per rule.
¹ Keynote works on iPhones, iPads, Macs and in many web browsers. Check your device against Apple’s latest guidance.
An activity worksheet for students and Keynote¹ presentation with answers. Four different elastic collisions are presented and students have to apply conservation of momentum and conservation of kinetic energy to the collision to determine the correct outcome. The problems range in difficulty from straightforward to advanced problem solving.
This is a free lite version of a premium product which includes the same task differentiated. In the differentiated version the same collisions are the basis of the question but there are multiple possible outcomes that students evaluate.
The worksheet should prove self explanatory for students. The presentation is designed to aid the teacher’s explanation but does not show all working.
¹ The presentation is made with Keynote which is Apple’s presentation software. It can be exported to PowerPoint but I don’t guarantee the output will look and operate in the same way. Keynote is an app available on macOS, iOS and iPadOS for free with most new or new-ish Apple devices. You have my permission to try exporting into PowerPoint for your personal use in teaching your classes.
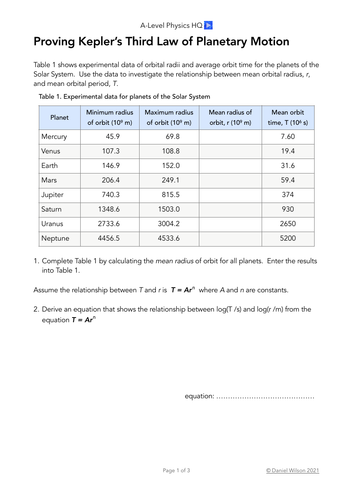
An activity to guide students through the analysis of real planetary data (orbit radius and period) to see if it is consistent with Kepler’s Third Law.
Includes:
A worksheet (PDF) for students with complete instructions. This can be issued to students as independent work in class or at home. Space is provided for working out and writing answers to the questions.
A Numbers¹ spreadsheet with solutions. There is an Incomplete tab, which can be projected whilst introducing the activity if desired. The Complete tab has all the solutions to aid the teacher as they work through it with the class. Solutions include results computed directly from the data using spreadsheet formulae and a separate table in which results from a hand drawn graph can be inputted and computed. The Printable tab has the solutions in a printable format if needed.
The Incomplete and Printable tabs from the spreadsheet are also included as separate PDFs for anyone unable to use the Numbers app.
¹ This is a Numbers spreadsheet. It is possible to convert Numbers spreadsheets to Excel files but I cannot guarantee an easy to use output since the tables may be converted to separate worksheets in the Excel file.
Activity for practicing plotting graph data points, drawing a line of best fit and calculating a gradient. The first page includes the activity for students to complete and the second page includes solutions to the questions. Suitable for AQA and OCR Physics A AS-Level and A-Level specifications.
(7407, 7408, H156, H556)
This is part of a series of worksheets for practicing different graph skills. Graphs Skills worksheets 1 & 2 are available for free, subsequent worksheets are premium resources.
This worksheet is great for home learning since it has solutions to all questions included in the document and it is part of a series that gradually builds up a range of graphing techniques.
Watch Felix Baumgartner’s Space Jump, collect velocity and time readings from the video, then analyse his motion on a velocity-time graph.
Complete worksheet with instructions for students with completed table and graph at the end.
Copy of the spreadsheet I used to analyse the Young’s Modulus experiment in my video on the experiment.
Now included: a version 2 of the spreadsheet with improved formatting. But note that in order to achieve the neater formatting it is necessary to use more advanced formulae which will make it harder for spreadsheet novices to understand the calculations (especially around indices). Both versions are included to give the user the option of which one to use.
This is a Numbers spreadsheet. It is possible to convert Numbers spreadsheets to Excel files but I cannot guarantee an easy to use output since the tables may be converted to separate worksheets in the Excel file.
Suitable for most A-Level Physics specifications.
This spreadsheet can be used to analyse the data collected in the CIE Practical Skills 1 (2016) task. I have a video of the data collection for this task and its analysis.
This spreadsheet has been created in Numbers (Apple’s spreadsheet software), it works on macOS, iOS, and iPadOS devices.
Activity for practicing plotting graph data points, drawing a line of best fit, calculating a gradient and analysing the line in order to calculate quantities. The first page includes the activity for students to complete and the second page includes solutions to the questions. Suitable for AQA and OCR Physics A AS-Level and A-Level specifications.
(7407, 7408, H156, H556)
This is part of a series of worksheets for practicing different graph skills. Graphs Skills worksheets 1 & 2 are available for free, subsequent worksheets are premium resources.
This worksheet is great for home learning since it has solutions to all questions included in the document and it is part of a series that gradually builds up a range of graphing techniques.
14 September 2024: It was brought to my attention that the data provided an invalid intercept value for analysis if imported into a spreadsheet to compute. I realised that two values for s suffered from typos (u=12 had s=35 and u=14 had s=42). These data give a negative intercept preventing correct analysis. The values have been corrected (u=12 had s=34 and u=14 had s=43). This affected the values in the tables, however, the values plotted on the grid were correct.