Hero image

ReallyUsefulMaths

Average Rating4.09
(based on 171 reviews)

The Resources within this shop are all designed for the teaching of Mathematics for those in the age range 7 - 18 years old. Most resources consist of a PowerPoint lesson followed by a worksheet for the students. With over twenty nine years of experience, the powerpoint/worksheets within the shop have been used successfully by myself and colleagues over that time. As a head of department for over 15 years, the department has yearly been judged as adding substantial value to students grades.

369Uploads

201k+Views

133k+Downloads

The Resources within this shop are all designed for the teaching of Mathematics for those in the age range 7 - 18 years old. Most resources consist of a PowerPoint lesson followed by a worksheet for the students. With over twenty nine years of experience, the powerpoint/worksheets within the shop have been used successfully by myself and colleagues over that time. As a head of department for over 15 years, the department has yearly been judged as adding substantial value to students grades.
Equivalent Fractions
sjcoopersjcooper

Equivalent Fractions

(0)
This lesson is intended for younger students, when first meeting the notion of equivalent fractions. The powerpoint consists of examples where shapes have the same amount shaded areas but divided into different amounts. Hence students can see equivalent fractions as being "the same" or better still equal through area shaded. The lesson also contains a worksheet with answers to backup the lesson.
A Dozen GCSE Maths Questions worksheet 3 & 4
sjcoopersjcooper

A Dozen GCSE Maths Questions worksheet 3 & 4

(1)
Following the Dozen questions theme, attached here are two more worksheets with the same theme. Each worksheet has 12 questions based on the material for the higher level new GCSE specification. Answers are also attached. A great way to identify whether students are solid on the topics selected.
Drawing other standard graphs
sjcoopersjcooper

Drawing other standard graphs

(0)
This lesson is a follow on from the lessons involving drawing the quadratic curve. The lesson consists of a couple of worked examples on drawing standard curves, followed by information about some standard graphs and their shape. The lesson also has an worksheet for students to tackle in class or as a piece of homework.
GCSE Mathematics Revision Game 6
sjcoopersjcooper

GCSE Mathematics Revision Game 6

(0)
GCSE Run around Game 6 This game is aimed at foundation students who have just been revising certain topics. Topics covered in this game are Sequences nth term Solving equations Dividing into a given ratio Factorising Decimals. This activity is aimed at Foundation students who are revising for their GCSE examination. Each round consists of four questions. Print the slides 8 to 13 on A4 paper and place one printed slide per table. Students are put into pairs (either by choice or teacher selection) and are given a copy of slide 14 and a few sheets of pieces of A4 paper. The pairs are designated a starting table and the timer (slide 2) is started. The students are then given 5 minutes to answer the four questions on that table. Once the five minutes is up the students move clockwise to the next table and start the next set of four questions and the timer of slide 3 is started. This continues until all students have completed the six tables worth of questions. The answering of the questions takes no more than 30 minutes. Students then remain at their final table, swap their answer sheet with the nearest table and the answers are produced. At this stage I go through the questions before revealing the answers. In this way the students have had a go at GCSE style foundation questions and have also seen a demonstration as to how they should have been answered. Finally, students add up their score and the highest score get a prize!
Reverse Percentages
sjcoopersjcooper

Reverse Percentages

(0)
This lesson demonstrates to students how we can find the original amount when a percentage has already been added on or subtracted off.
Introduction to Projectiles
sjcoopersjcooper

Introduction to Projectiles

(0)
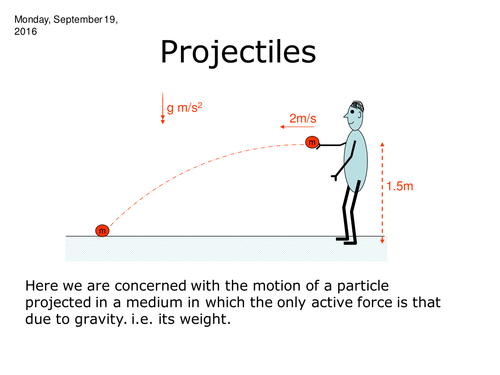
This lesson is an introduction to projectiles. It is assumed that students are already familiar with the standard formulae used in kinematics when a body moves in one direction. I always start this lesson by throwing the board pen horizontally and students witness that it moves in two directions. We discuss the acceleration acting on the body and hence the first example is on this basis. I follow that up with some more worked examples before giving them a standard diagram for projectiles.
Transformations with Matrices: Using the unit square
sjcoopersjcooper

Transformations with Matrices: Using the unit square

(1)
This lesson consists of a series of examples which demonstrate how a unit square can be used to determine which transformation a given 2x2 matrix represents. Also the unit square can be used to create a 2x2 matrix. The lesson concludes with a set of questions for the students to answer. I tend to use this lesson when teaching the Further Mathematics GCSE.
Function of a function rule (chain rule)
sjcoopersjcooper

Function of a function rule (chain rule)

(0)
This lesson is an introduction to the more complicated differentiation. Using the knowledge of basic differentiation these examples introduce students to differentiation by substitution before using the rule. I teach this rule this way first before showing them the quick approach when teaching the product rule and quotient rule.
Tangents and Normal to a curve
sjcoopersjcooper

Tangents and Normal to a curve

(0)
This lesson teaches students what is meant by a tangent and normal to a curve. The lesson then works through some examples finding the equation of a given tangent or a given normal.
Arithmetic Progressions
sjcoopersjcooper

Arithmetic Progressions

(1)
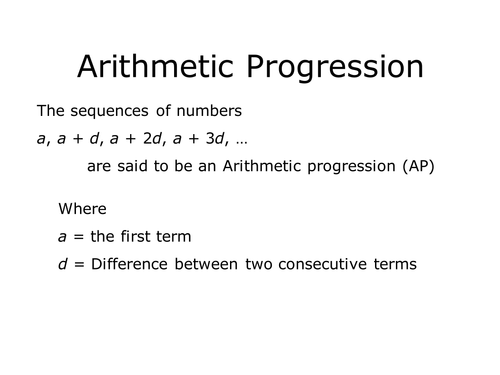
This lesson furthers a students knowledge from GCSE of the arithmetic progression. It introduces the students to a formula used for the nth term and has a proof for the sum of n term. The lesson then has a series of worked examples.
Circular Measures: Radians, Arc length and area of a sector
sjcoopersjcooper

Circular Measures: Radians, Arc length and area of a sector

(0)
This lesson introduces students to the angle measure the Radian. There is a quick proof of the Area of a sector and arc length formulae. Followed by several worked examples on the use of these formulae. It is expected that students would have met the area of a triangle formula in trigonometry before this lesson.
Surface Area
sjcoopersjcooper

Surface Area

(0)
This lesson looks at finding the surface area of shapes such as cuboids, square based pyramids, cylinders, cones and spheres. The lesson also shows a proof for the surface area formula of a cone. However for this students to understand this proof it is essential that they have already met arc length and area of a sector. The lesson contains a number of worked examples.
New Grade 6 Material: Test 1
sjcoopersjcooper

New Grade 6 Material: Test 1

(0)
This is a Test I will use to check whether my students have met the standards required for topics which have been labelled as grade 6 in the new GCSE. Clearly I have listed which topics are tested and students are given this list in advance so that they can revise the highlighted topics. More tests will follow as I prepare them and then bundles will become available.
Angles in a triangle or quadrilateral
sjcoopersjcooper

Angles in a triangle or quadrilateral

(0)
The power point presentation shows students why angles in a triangle add up to 180. Prior knowledge is required here of the angles on a straight line and/or Alternate angles. The power point has a series of worked examples for the angles in a triangle before looking at the angles in a quadrilateral. Following the angles in a quadrilateral there are a series of cards that can be printed to go with a collection of questions at the board. (a bit like bingo) Students answer each question and should find a number that can be crossed out. The winner being the one who completes their card correctly!
Area of a circle
sjcoopersjcooper

Area of a circle

(0)
A lesson introduces the students to pi. Students work out for themselves with little guidance that pi is approximately 3 or even 3.1. This also gives the teacher the opportunity to introduce the formula for the area of the circle. The follow up lesson also on this resource has several examples involving finding the areas of circles. The resource also contains a worksheet for students to answer either in class or as a piece of homework.
The Sine Rule
sjcoopersjcooper

The Sine Rule

(0)
Lesson introduces students to the Sine Rule formula which can be used for a variety of triangles. The lesson then has a series of worked examples before ending with a a number of questions for students to complete.
PowerPoint to help students learn their multiplication tables.
sjcoopersjcooper

PowerPoint to help students learn their multiplication tables.

(0)
A series of slides which help students learn as a class their multiplcation tables. A teacher can jump to a particular times table for students to watch has the times tables pop up when directed. Also there is a final slide which I've found useful for some students.
Area & Perimeter of a rectangle
sjcoopersjcooper

Area & Perimeter of a rectangle

(0)
These two lessons I usually teach to year 7 students. However it could be taught at primary of even higher than year 7, if students struggle with area and perimeter. The powerPoints consist of worked examples demonstrating how we find the area of a rectangle or perimeter.
Decimal Places
sjcoopersjcooper

Decimal Places

(0)
This Lesson in a PowerPoint which introduces students to the topic of decimal places through a series of worked examples.
Calculating the mean from a frequency table
sjcoopersjcooper

Calculating the mean from a frequency table

(0)
This Powerpoint consists of a variety of worked examples which demonstrate how we can calculate the mean by using the "fx" column. The lesson starts with students asked to calculate the mean of a large set of data. Next by placing the data into a tally chart it is easy to show how much quicker it is to calculate the mean when presented in this format rather than a list of numbers.