
84Uploads
10k+Views
6k+Downloads
All resources

Porter's Five Forces
This PowerPoint introduces the theory of Porter’s Five Forces
Contextualised examples included (including why Apple hasn’t entered the airline example)
Each force is explained individually
Notes provided throughout
PowerPoint is colourful and engaging

Free, Mixed and Command Economies
The PowerPoint attached is an informative presentation that explains the difference between command, mixed and free market economies.
Contextualised exams provided throughout.
This presentation contains 18 slides and took me 30 minutes to go through

Change Management (Business)
This resource is a detailed, comprehensive PowerPoint (124 slides) on change management.
The resource is split into four separate lessons that breaks down the topic in manageable chunks.
The resource contains:
several starter activities
videos
animations
exam practice
detailed notes
Coliurful and engaging throughout.
This resource lasted a full week of lessons (3 hours) for me


Globalisation / Introduction to International Marketing
Using MCDONALD’S TSUKIMI BURGER, Tesco’s failure to succeed in the US, Apple’s failure to succeed in India, and many others, this PowerPoint seeks to explore the reasons why businesses wish to sell in international markets, the challenges and constraints.
Included in this PowerPoint:
A detailed title page, outlining the key skills covered in this topic
A recap on moving averages with answers. This topic is included in some syllabi earlier in the marketing unit but can be deleted if not required
A starter activity introducing the concept of globalisation where students need to match McDonalds products based on the country whey are sold
(demonstrating how products need to be adapted based on the market they are targeting). Answers are provided
An explanation of reasons why businesses choose to sell products in overseas markets
A contextualised example for each reason
Detailed explanations as to each of the reasons why how marketing activities need to change depending on which country goods are being sold
Video 1: Reasons why Tesco failed in US (poor marketing)
Video 2: Reasons why Apple failed in India (poor marketing)
Introduction to some of the factors that make trade between countries easier
This lesson took me an hour and a half to go through.
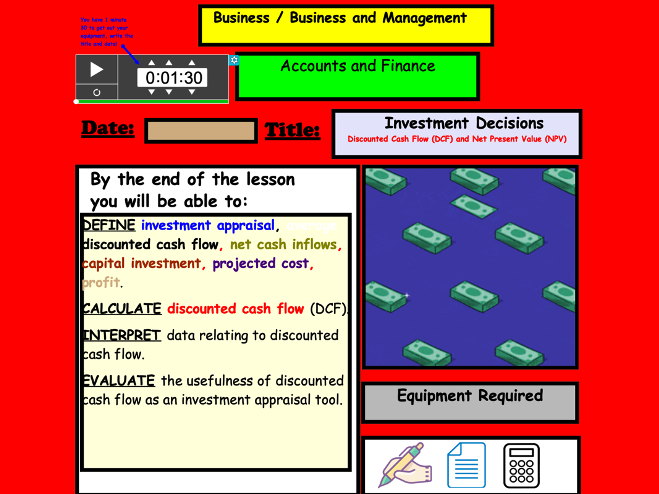
Net Present Value
Net Present Value is a topic that students often find challenging. This presentation has been produced so that students of all abilities can access the topic. Using lots of colour and engaging slides, contextualised examples as well as step by step examples, this presentation has proven to be very successful in getting my students to understand this net present value effectively.
Included in this presentation:
A detailed title slide including key skills covered in the lesson and equipment required
Initial starter activity where students need to calculate the payback period and average (accounting) rate of return. The aim of this activity is to get students to think about how using both of these methods can provide conflicting results (one investment option could have a shorter payback period where the other could have a higher average rate of return). Activity and answers included in slide, as well as explanation of how these figures were calculated.
Step by step guidance as to what the net present value and time value of money means (we look at why it is better to have £100 now rather than next year)
Activities that explain what inflation and interest rates are, and how they affect the value of money (guess the price activity can be done on mini whiteboards or completed as a class)
Step by step guide demonstrating how net present value is calculated
An explanation of how net present value can be applied to investment decisions
An evaluation of the usefulness of net present value, with examples provided.
This presentation contains 53 slides and took me just under 2 hours to go through in detail.

Poverty, Lorenz Curve, Gini Coefficient
This presentation contains:
Colourful, detailed and engaging slides throughout
A ‘random name selector’ key term starter activity
7 timed past MCQs on a range of Economic concepts (interactive timer included) All answers included.
Activities throughout
Detailed notes throughout
Explanations of Lorenz Curve and Gini-coeffient
A comprehensive presentation.
There are 65 slides in total and this lesson took me an hour and a half to go through with students

Business Ownership
An 89 slide, detailed PowerPoint presentation on forms of business ownership. This presentation goes into detail about:
The public sector
The private sector
Soletraders
Partnerships
Limited Companies
Not-for-profit organisations
This presentation includes a number of editable recap activities (decision tree, guess the question, etc)
Colourful, interactive with animations throughout.
This presentation took me 3 hours to complete with my students
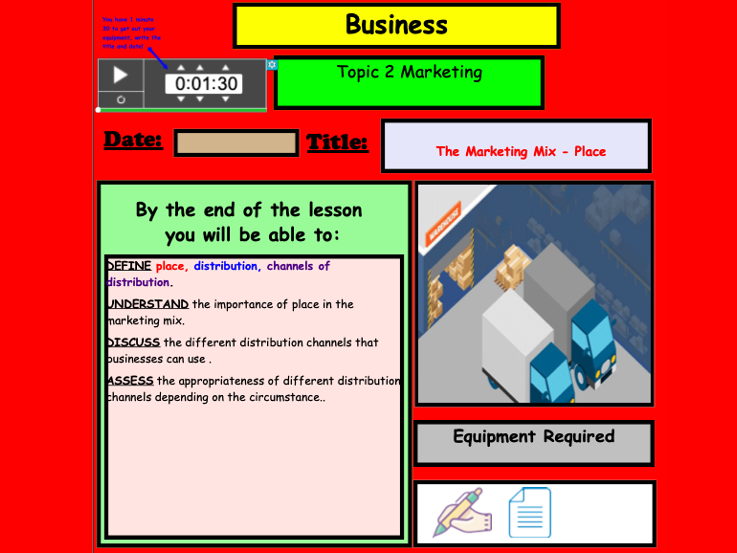
Marketing Mix - Place
Included in this presentation:
A fun Catchphrase starter activity (my students love this!)
A recap activity on cost-based pricing strategies with answers (feel free to remove or skip if you are you to cover this)
Notes and examples on the different methods of distribution
Notes on the pros and cons of each method of distribution
Notes on the importance of selecting the most appropriate method of distribution
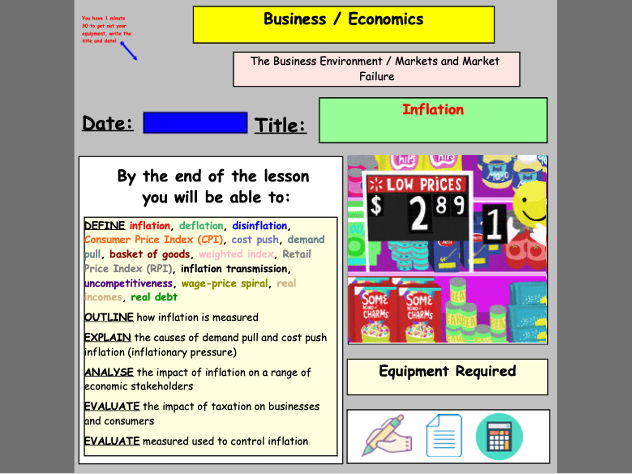
Inflation
Included in this PowerPoint:
A detailed and colourful title slide that outlines the key learning outcomes and equipment required for the lesson
A starter activity where students are required to guess how the price of 5 goods and services has changed over time (closest for each round wins). Students really enjoy this activity
Explanation of why / when inflation becomes a problem, how it affects incomes and sectors where incomes have risen lower and higher than inflation
Explanation in basket of goods / weighted index
Step by step explanation of how inflation is calculated using weighted index
Activity (with answers) where students are required to calculate inflation changes using a weighted index
Activity (with answers) - identify which goods and services have been recently added and removed from the basket of goods
Explanation of difference between demand-pull and cost-push inflation with examples
Diagrams for both types of inflation
Presentation is detailed and colourful throughout
There are 52 slides in total and this presentation took me an hour and a half to go through.
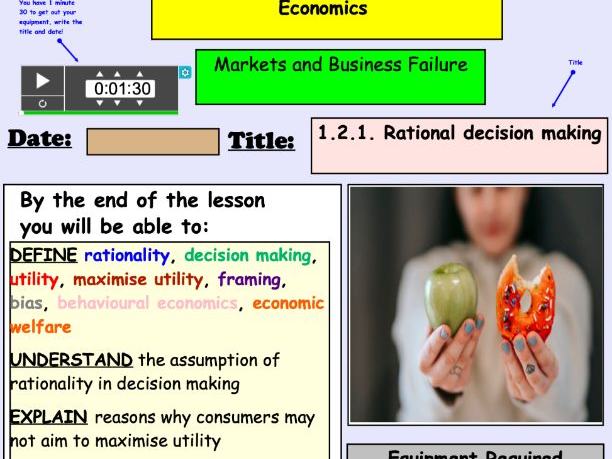
Rational Decision Making
This resource is a 17 slide PowerPoint that explains the concept or rational decision making.
Included in the presentation:
A colourful and informative title slide that outlines the learning objectives
An engaging and interactive online ‘vortex’ starter activity. Students need to match which key term links with which of four topics. Activity is self marked and instructions are included
Explanations of how rational decision making is a principle of neo-classical economics
Contextualised examples of how customers don’t always act rationally (Nudge Theory, Third Decoy, Dopamine, FOMO)
Explanation as to why consumers may not act rationally
This resource took me 30 minutes to complete

Terms of Trade
This colourful and informative resource is fully comprehensive, and includes a number of tasks that test learning that do not require any marking from the teacher.
Included:
A detailed and colourful title screen, outlining the learning objectives and including an interactive timer and picture animations
A ‘guess the question’ starter activity with answers that tests understanding of earlier macroeconomic content
A quiz on UK imports and exports
Detailed explanation of ‘weighted indexes’ with questions and answer scheme included
Past exam question with mark scheme on terms of trade
Link to a video reviewing terms of trade and index numbers
Detailed explanations of factors affecting terms of trade and Prebisch-Singer hypothesis
8 mark question with mark scheme
Homework tasks, including a link to a Teams Quiz with 17 questions on terms of trade. Questions are self-marked when students respond
All resources took me 3 lessons to go through

Advertising, Media and Peer Pressure
A financial education lesson on advertising, media and peer pressure.
Included:
Colourful and interactive slides with timers, animations and videos
Activities (with answers) throughout
Worksheet included
Detailed notes
There are 37 slides in total and this lesson took me an hour and a half to go through

Economics as a Social Science (Lesson + Worksheet)
This PowerPoint presentation and worksheet has designed based on the Edexcel A Level Specification but can be applied to any exam board.
The PowerPoint includes:
Detailed and colourful title page with animations, auto calendar date, gifs and timer
Starter activity that test students’ understanding of economic terminology they should be familiar with in the news
Detailed explanation of what economics is
Challenging assumption activity
Detail notes
All answers included
The worksheet has 4 activities:
Match important key terms relating to this lesson
Challenge the assumption activity
Micro or macro scenario
UK economy trivia

Human Development Index
A lesson that explains what HDI, how it measured and other measured of development.
Explanations, editable starter activities and videos included

Allocative Efficiency (Economics)
Arguably the trickiest of the efficiencies students need to understand.
This presentation has been designed to break this efficiency down and explain it step by step.
Productive and dynamic efficiency also recapped in a starter activity.
Lots of activities included in the presentation.
Last few slides go through exam technique for 8-markers (Edexcel) with a sample question and model answer

Eduqas Business A Level Model Answers
Please find some examples of model answers from Paper 1 of 2022. I’ve included explanations of exam technique on many of the questions.
Please be aware - ARCADE-J is a mnemonic I use with my students for questions that require evaluation, such as Assess, Recommend, Consider, Advise, Discuss, Evaluate, Justify
Price Elasticity of Demand
Colourful. Engaging. Informative. This PowerPoint has been creating to introduce students to the concept of price elasticity of demand.
Included in this PowerPoint:
A detailed and colourful title page, highlighting the skills that will be covered over the duration of this topic
A starter activity where students need to rank in order which goods / services would be most to least affected by a change in price
Discussion points
Slides detailing how price elasticity of demand is calculated, with an example
Slides explaining what the numerical values mean (how to interpret them)
Calculation questions with answers
Explanation of the factors affecting price elasticity of demand
This resource took me one hour to go through as a class
Payback Period
Colourful slides, animations, video links, fun activities, as well as questions (with answers provided) are all included in this engaging and informative lesson on calculating the payback period, applicable to all syllabi
Included in the lesson is:
A fun (and very popular with my students!) Catchphrase starter activity where students have to guess the name of a well-known brand or product from a selection of pictures. Answers are provided.
An eye-catching slide used to explain the purpose of the lesson and introduce the terms capital investment appraisal.
An explanation of what it means to invest
Contextualised examples and explanations of what investing is with colourful slides and video links provided (a Bitcoin video is included as well as a link to live house price updates)
A ‘guess the price of the good’ activity that demonstrates reasons why people make investments (to get a return on their investment)
Examples of real business investments (Facebook purchasing WhatsApp, Oculus, extra warehouses for servers)
Explanation and step by step demonstration of how to calculate the payback period
A 10 - 15 minute activity where students need to calculate the payback period. Answers provided.
An explanation as how to evaluate the payback period
It took me a lesson and a half to go through all of the content

Maslow's Hierarchy of Needs
Full resource (68 slides) on Maslow’s hierarchy of needs.
Included in this resource:
Colourful and interactive title page , including timer and auto date
Catchphrase starter activity (with answers)
Step by step explanation of each need in the hierarchy
Contextualised examples
Trivia activity
Exam skills activity with answers