Hero image

Colinbillett's Shop

Average Rating4.43
(based on 1520 reviews)

I taught in a range of schools for many years before moving into FE, where I found creative and imaginative approaches just as rewarding with adults. Most of my resources are concerned with giving control to the learner, through a range of methods. Some are great for just giving them experience of examination questions, and the chance to discuss these with other learners. I now concentrate on spreading the range of creations from UK KS1 to KS4, and across the Common Standards.

309Uploads

1525k+Views

1743k+Downloads

I taught in a range of schools for many years before moving into FE, where I found creative and imaginative approaches just as rewarding with adults. Most of my resources are concerned with giving control to the learner, through a range of methods. Some are great for just giving them experience of examination questions, and the chance to discuss these with other learners. I now concentrate on spreading the range of creations from UK KS1 to KS4, and across the Common Standards.
Two-way tables Math up to Grade 8 Introduction, worksheet and plenary quiz, with lots of questions!
colinbillettcolinbillett

Two-way tables Math up to Grade 8 Introduction, worksheet and plenary quiz, with lots of questions!

(0)
Two-way tables are very popular questions, and great for getting learners to think logically. Progressive tasks from simply filling in the missing numbers through to creating tables from scratch. The common standards require learners to use two-way tables to answer questions on conditional probability so I've included a recap quiz that does just that - asks probability questions on a colourful quiz. Plus a lesson plan, so everything you need for a lesson or two. All images ©2015 Colin Billett
Maths Year 6 algebra, KS3 or KS4 revision.  Four games to try - throw the dice, match to equation.
colinbillettcolinbillett

Maths Year 6 algebra, KS3 or KS4 revision. Four games to try - throw the dice, match to equation.

(5)
Four games to play to reinforce solving simple equations and substitution, so quite suitable for year 6 and key stages 3 or 4. Throw the dice, and match the equation to the score. Claim that tile, and the next person throws. All solutions are in the range of 1 - 6, so easy arithmetic. But game can be adapted any way you like - solve all the equations first, then play the dice game to make three in a row, or four in a row. The second set is throw the dice and substitute the scores into the expressions, then find the numbers in the grid. Give feedback please, on suggested improvements.
Math Grades 7+ Multiple resources on multiplying and factorising parentheses and quadratics.
colinbillettcolinbillett

Math Grades 7+ Multiple resources on multiplying and factorising parentheses and quadratics.

(0)
PowerPoint presentations on using the grid method, plus a poster and an investigation into multiplying diagonals. Worksheets to practice multiplying and factorising two parentheses, and lots of questions on solving quadratic equations, including GCSE examples. Plus questions on matching quadratic graphs to expressions. All answers provided either in Word and/or PowerPoint. Everything you need for a couple of lessons at least.
Math: Grades three through to eight, lots images of fractions/decimals/percentage plus activities.
colinbillettcolinbillett

Math: Grades three through to eight, lots images of fractions/decimals/percentage plus activities.

(2)
These have been enormously popular. I teach a number of people who are far more artistically minded than mathematical, so I produced some visual displays to illustrate equivalences. Run the PowerPoint, or print off some slides for display. I've also added a few posters by way of example of how you might use the individual slides. For classroom activities I’ve included five pages of shapes to color for fractions etc to keep or display. Everything included in editable format, so use as many slides as appropriate for your age group or grade, or change the shapes pages as required. All images ©2015 Colin Billett
Math Grade 8 The length of a line using Pythagorean Theorem. Posters, presentation and puzzles.
colinbillettcolinbillett

Math Grade 8 The length of a line using Pythagorean Theorem. Posters, presentation and puzzles.

(0)
A very full set of resources to apply the Pythagorean Theorem to finding the length of a line drawn on a coordinate grid. PowerPoint presentation with early slides reminding learners of the principles and knowledge. Later questions apply the knowledge and lead on to generalizations. Plus extra worksheets on finding perimeter of polygons and finding the area of a circle drawn on a coordinate grid. Surds and use of pi encouraged in line with 2015 UK curriculum. Grade 8 - Understand and apply the Pythagorean Theorem. 8. Apply the Pythagorean Theorem to find the distance between two points in a coordinate system.
Algebra card matching
colinbillettcolinbillett

Algebra card matching

(2)
Algebraic statements in symbols, with with corresponding word descriptions, and representations as areas in the plane, along with function tables. Match up any sets you like - words and symbols seem to go down well, along with the pictorial representation.
Algebra - Equations
colinbillettcolinbillett

Algebra - Equations

(9)
A set of cards for talking about algebraic statements. Plus a powerpoint version for discussion, and a powerpoint version with the answers.
PEMDAS
colinbillettcolinbillett

PEMDAS

(4)
Matching cards for statements and answers; with index numbers; parentheses; changed order etc.Plus a PowerPoint of the questions for discussion; plus a PowerPoint of the answers if one runs out of time.
Distance - Time graphs
colinbillettcolinbillett

Distance - Time graphs

(19)
A set of cards for discussion and matching of possibilities, plus a powerpoint of the questions for group reflection, and another powerpoint of some possible answers.
Math Grade 6 Statistics of grouped data. Data in class intervals. Practical examples & worksheets.
colinbillettcolinbillett

Math Grade 6 Statistics of grouped data. Data in class intervals. Practical examples & worksheets.

(0)
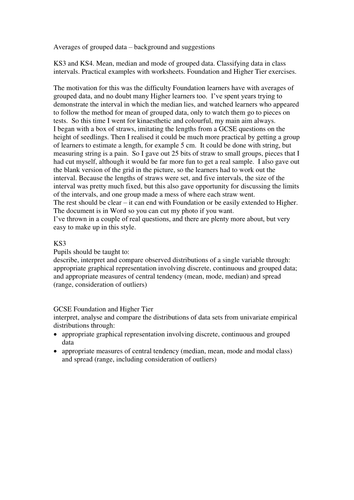
The motivation for this was the difficulty learners have with measures of centre of grouped data, and no doubt many otherlearners too. I’ve spent years trying to demonstrate the interval in which the median lies, and watched learners who appeared to follow the method for mean of grouped data, only to watch them go to pieces on tests. So this time I went for kinaesthetic and colourful, my main aim always. The documents are in Word so you can cut my photo if you want. I’ve thrown in a couple of real questions, and there are plenty more about, but very easy to make up in this style. All images (c)2015 Colin Billett
Math Probability Grades 6, 7.  Lots of resources, lots of activities.
colinbillettcolinbillett

Math Probability Grades 6, 7. Lots of resources, lots of activities.

(0)
A set of great stuff for theoretical and practical lessons on probability. Lots of questions, a PowerPoint introduction that can be fitted in at any time, a quiz that could end one lesson or start another, and events for printing on cards and sorting into order of likelihood. Plus a set of questions for recap and revision. Enough for a couple of lessons, and lots of photographs that will give you and the learners ideas for creating your own questions. All images (c)2015 Colin Billett 'Investigate chance processes and develop, use, and evaluate probability models. Understand that the probability of a chance event is a number between 0 and 1 that expresses the likelihood of the event occurring. Larger numbers indicate greater likelihood. A probability near 0 indicates an unlikely event, a probability around 1/2 indicates an event that is neither unlikely nor likely, and a probability near 1 indicates a likely event. '
Maths Statistics Box (and whisker) Plots - Full lesson of stuff!
colinbillettcolinbillett

Maths Statistics Box (and whisker) Plots - Full lesson of stuff!

(0)
Everything you need for a lesson (or two) on creating, reading and interpreting box and whisker plots. Starter activity on PowerPoint to review stem and leaf diagrams; a presentation in PowerPoint on creating, reading and interpreting a box plot with two examples; learner activities, questions in Word or PDF; a plenary presentation in PowerPoint to check learning; and a lesson plan to make the whole thing complete.