


Recent
Most read
Most shared

The full extent of the attainment gap between GCSE students in the North of the country and the South has been revealed in a series of new maps.
An analysis of schools’ provisional attainment figures by education data firm, SchoolDash, has shown how 15- and 16-year-olds in the South East and South West are outperforming their peers in the Midlands northwards.
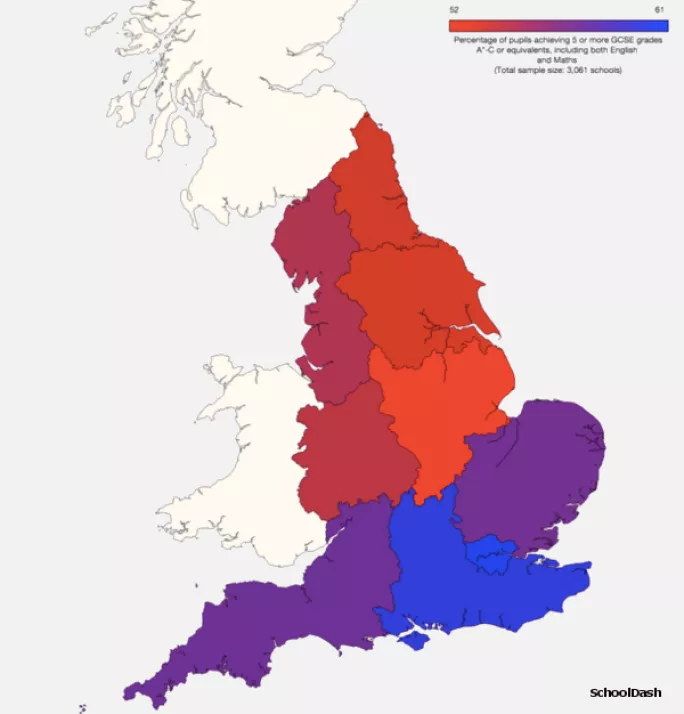
The maps show the percentage of students hitting the government’s headline GCSE measure of five A* to C grades including English and maths. The higher the percentage of pupils achieving the benchmark, the bluer the colour; the lower the figure, the more red it is.
According to the provisional data, published last month, 4.7 percentage points more students managed to gain the five good GCSE target in the South than in the North.
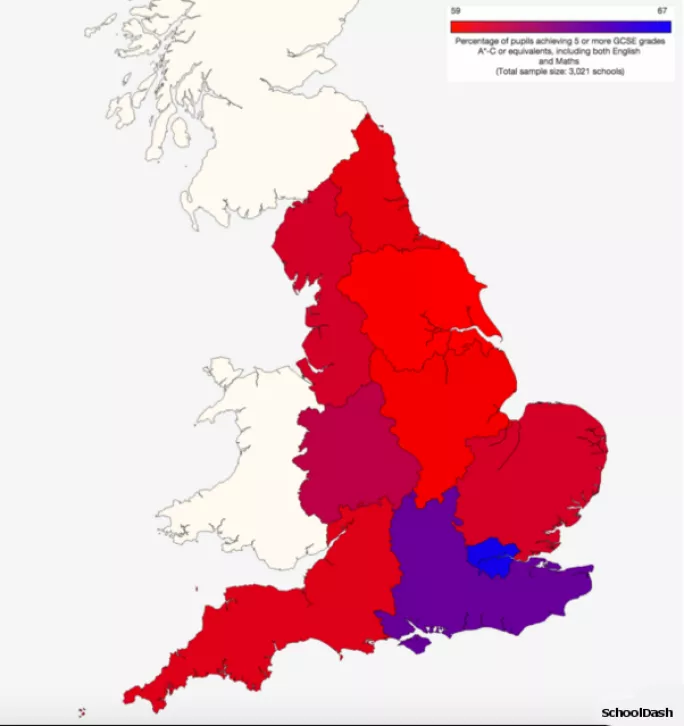
The figures show that the gap has widened in recent years, with students in the South, particularly in London, far outstripping their counterparts in the North. The map below shows the attainment gap was 2.8 per cent in 2013 compared with 1.8 per cent in 2012.
Perhaps most interesting, however, is that the divide grows once students enter secondary school. As the map below shows, the attainment gap between the North and South all but disappears when looking at key stage 2 results from 2014. Both the North West and North East perform particularly well when looking at Sats results.
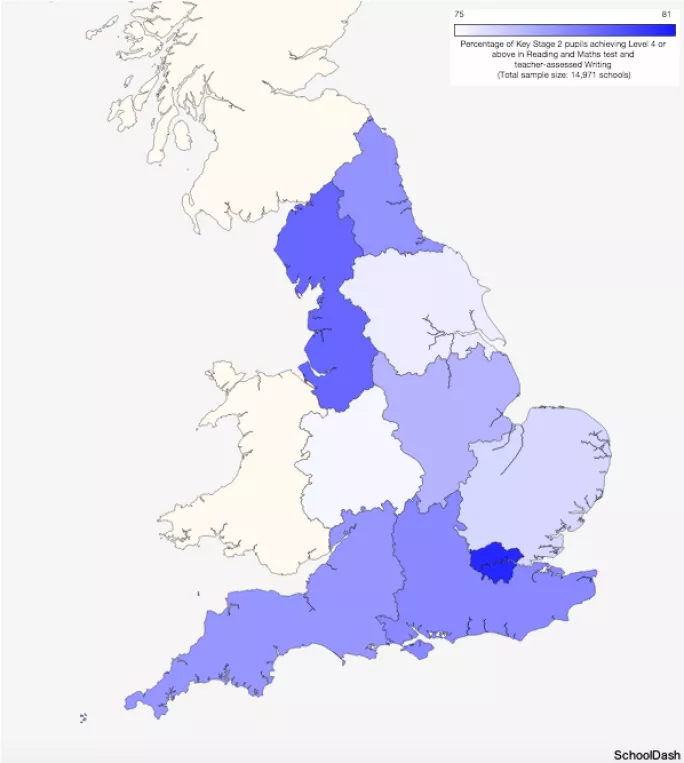
The data would appear to lend more credence to Ofsted’s concerns about key stage 3, particularly outside the capital.