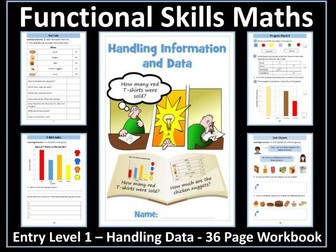
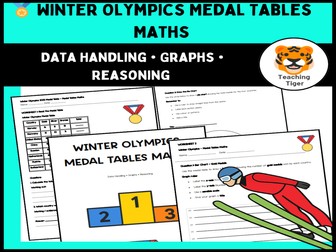
Fun with frogs and data handling at KS1.
The lesson starts with children looking at the colour poster of 18 frogs all wearing different hats.
Children observe carefully looking at the frogs eye colour and types of head wear.
Sheet 2 asks children to count and record e.g. number of frogs with brown eyes/party hats/work hats.
There are 5 questions to answer.
Sheet 3 is for children to draw a hat on each of the frogs and label them.
Sheet 4 shows frogs in different positions or activities. Children colour the matching frogs to make them the same.
Sheet 5 shows 2 writing frames for children to write about frogs or their findings of the data handling activities.
This is a resource I have used all week for a middle ability year 4/5/6 class. Covering pictograms, caroll diagrams, bar chars, line graphs and venn diagrams.
a good starter/ revision activity on analysing and processing numbers to work out fractions, decimails, ratio or % from whole numbers. it also covers probability (OR/ AND RULE) and other averages.
I will be suitable for L2/ GCSE students on F/H tiers. I have used it for my revision classes and it was a good resource.
A collection of worksheets and activities in a range of styles. Some activities are pair work/ lead to class discussion. Includes a wordseach. Also a handling data Project - which is the fittest form.
This little PowerPoint introduces two skills from the Information Technology Skills Ladder.
I can use key words to describe and find objects IT-DH1
I can sort objects into different groups IT-DH2
This resource has been designed for students working towards Functional Skills Maths qualifications at Entry Level 1. It contains an age-appropriate,36-page workbook on handling information and data - Outcomes 11,12,13.
The 35-page workbook contains 10 information pages, 24 worksheets (with answers), 2 progress checks and a certificate of achievement. The workbook will help pupils to achieve these outcomes:
read numerical information from lists
sort and classify objects using a single criterion
read and draw simple charts and diagrams including a tally chart, block
diagram/graph
The resource is provided in PDF format and an editable PowerPoint version to enable personalistion of the resource. It can be used for classwork, homework, revision or as an independent learning pack.
Please note, the watermark on the preview images is not present on the resource itself.
If you buy this resource and are pleased with your purchase, I would be extremely grateful if you could leave a review. As a token of appreciation, you can have a free resource of your choice up to the same value as your purchased resource. Just email inspireandeducate@aol.co.uk with your user name, the resource you have reviewed and the resource you would like for free.
You may also be interested in:
Entry Level 1 - Handling Data - 100+ Slide PowerPoint Lesson
The PowerPoint clearly explains how to read numerical information from lists,
sort and classify objects using a single criterion, read and draw simple charts and diagrams including a tally chart and block graph.The PowerPoint provides many opportunities for pupils to identify data from lists, tally charts and block graphs. It is ideal for introducing the handling data component of the specification and for revision purposes.
Save money and buy both resources at a discounted rate:
Entry Level 1 - PowerPoint Lesson and Workbook
Functional Skills Maths - Entry Level 1 Bundle
This bundle contains 10 workbooks and 10 PowerPoint lessons that cover the entire specification for Entry Level 1.
Functional Skills Maths - Entry Level 2 Bundle
This bundle contains 13 workbooks and 13 PowerPoint lessons that cover the entire specification for Entry Level 2.
Functional Skills Maths - Entry Level 3 Bundle
This bundle contains 16 workbooks and 16 PowerPoint lessons that cover the entire specification for Functional Skills Maths at Entry Level 3.
This 9 page booklet is designed to help students and parents when with mathematical questions within their class and homework be it in Maths, Science, Geography, etc.. Topics Include:
Tables
Bar Graphs
Line Graphs
Scatter Graphs
Pie Charts
Averages
Includes:
- Finding and sorting Information
- Displaying Information (line graphs, tally charts, bar charts/graphs, Carroll diagrams and Venn diagrams)
- Code breakers
- Interpreting data
Can be adapted for upper KS1 and lower KS2
This document is a revision booklet I put together for my students over the years. It contains worked examples and notes describing how certain problems are solved.
Great worksheet to help learners develop basic data handling skills- counting,recording, adding and comparing data.
Learners carry out survey by asking their classmates the means of transport they use to school, record their names and tick against the means of transport on a chart.
They then use the data on the chart to workout the total number of people that use each means of transport, the most popular and the least popular means of transport.
A mixed bundle of resources which can be used as starters/ homeworks and to make the handling data units in years 7/8 a little richer. Includes a suggested handling data project resources and probability worksheets.
Data handling
The worksheet consists of an information text. Based on this text, there are various exercises such as matching tasks, multiple-choice questions, open questions and true-false questions.
You receive the material and solutions in PDF format for easy printing and in docx format for individual customization.
Challenging year 6 data handling ‘burglary’ investigation.
LO: To use statistics to solve real life problems
Lesson plan
PowerPoint
Investigation sheet
Clue hint cards
Answers
A Powerpoint presentation for teaching vocabulary used in maths related to handling data, including ways of presenting data and statistics. Primarily for use with EAL or ESOL students in school but could be used with adult learners of ESOL or Literacies who are working on numeracy or maths skills. Included in the presentation are links to my vocabulary wordsets in Quizlet (‘tables, charts and graphs’ and ‘statistics’.), enabling the use of online flashcards, matching games and tests. There is also a video quiz using Peter Weatherall’s you tube video about median, mode and mean. This is part one of my English in Maths series.
Designed for upper KS2 this activity will enable pupils to understand the purpose of collecting and analysing data. It is differentiated 3 ways with support for the less able and challenges for the more able. It also comes with ideas for further activities which could be used to form the basis of a mini project, ideal for the end of term.