27Uploads
30k+Views
18k+Downloads
All resources

Fractions, Decimals, and Percents including Simple & Compound Interest
This PPT is packed with multiple lessons.
Converting fractions to decimals to percents.
Finding the Percent of a number
Problem solving with percents
Percent of Change (mark up and discount)
Simple and Compound Interest

Theoretical and Experimental Probability
ppt on Theoretical and Experimental Probability including word problem applications

Bar Charts
Objectives of PPT:
Collect information using a data collection sheet.
Construct bar charts
Interpret bar charts
Includes a starter and plenary bingo

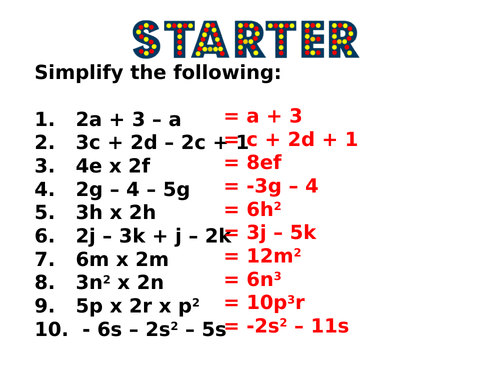
Simplifying Fractions
This PPT can be used for lower ability students in Years 7-11. It can also be used as a starter for higher ability students.

Pythagoras’ Theorem
Learning Objectives:
To be introduced to the properties of right-angled triangles
To discover the theorem of Pythagoras
To appreciate the meaning of “proof”
To solve multi-step problems using the theorem

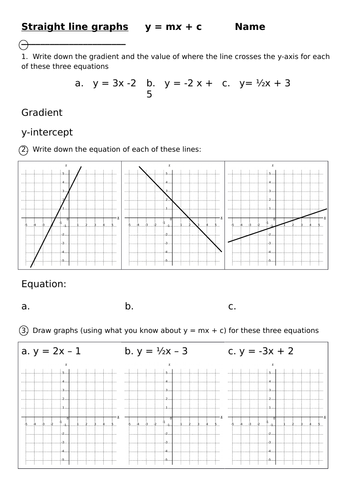
New GCSE Topic Practice Worksheets + Answers+ Maths Watch Links
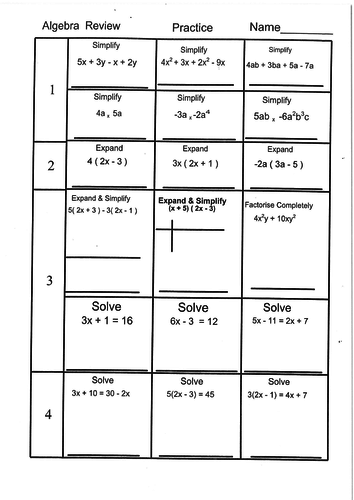
All New GCSE Topic Practice Worksheets + Answers+ Maths Watch Links
The sheets are double sided and have levels 1-9

Precentages Treasure Hunt
Instructions
Print one answer sheet per team (plus a few spares) and one set of question cards. Arrange the question cards around the classroom / maths block / playground in the order of the reference numbers in the bottom left hand corner. Impress upon the students that this is not the order in which they will answer the questions.
Each team starts at a different question card – they write the answer from the top of that card in the top left corner of their answer sheet. They then solve the problem on the card and write their answer in the next empty circle. They then look for that answer at the head of another card and answer the question on that card next. So it continues until they get back to where they started.

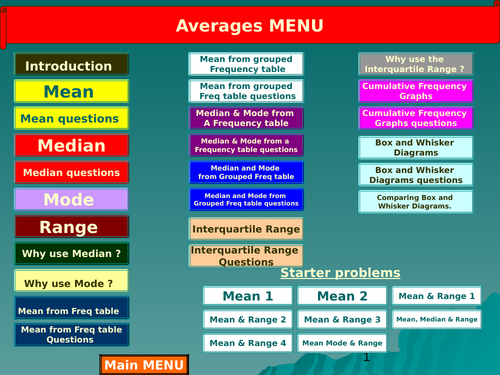
Averages COMPLETE Unit KS2-KS3-KS4
Complete unit of averages for the entire KS2-KS4 curriculum. Over 50 slides!

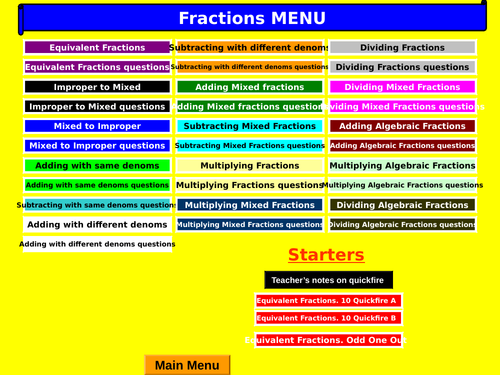
Fractions Unit COMPLETE KS3-KS4
Complete unit of fractions for the entire ks3-54 curriculum. Over 100 slides!

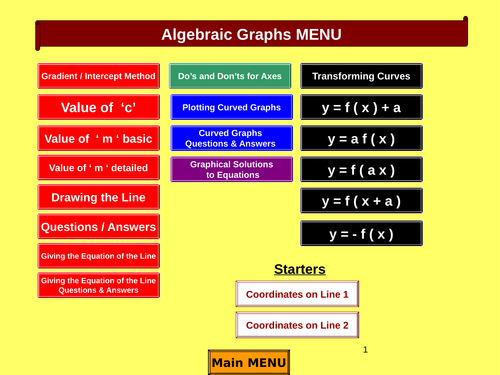
Algebraic Graphs KS3-KS5
Complete unit of algebraic graphs for the entire KS3-KS5 curriculum. Over 100 slides! Straight lines, quadratics, and curves.

Negative Numbers COMPLETE KS2-KS3-KS4
Complete unit of negative numbers for the entire KS2-KS4 curriculum. Over 100 slides!

