International
Resources
Topical and themed
Pre-K and Kindergarten
Elementary
Middle school
High school
Special education
Education Jobs
Schools directory
News
Courses
Store
Resources
Education Jobs
Schools directory
News
Search
Tes for schools
Log in
Register
for free
Resources
Education Jobs
Schools directory
News
Magazine
Courses
Log out
Help
Home feed
My list
Courses
My Jobs
Job alerts
My CV
Career preferences
Resources
Author dashboard
Settings
Edit account
Log out
Home
Resources
Jobs
Schools directory
News
Magazine
Courses
Register for free
Log in
Help
Thelessonlibrary's Shop
Add a resource
Edit shop
Average Rating
4.30
(based on 17 reviews)
Thelessonlibrary's Shop
Average Rating
4.30
(based on 17 reviews)
Edit shop
Add a resource
82
Uploads
19k+
Views
8k+
Downloads
All resources
Business and finance
Economics
Personal, social and health education
More
All resources
Relevance
Relevance
Newest
Highest rated
Lowest price
jonathanremmington1
Human Development Index
(0)
jonathanremmington1
Business Objectives (Economics)
(1)
jonathanremmington1
Capacity and Capacity Utilisation
(0)
jonathanremmington1
Cross Elasticity of Demand
(0)
jonathanremmington1
Cross Elasticity of Demand
(0)
jonathanremmington1
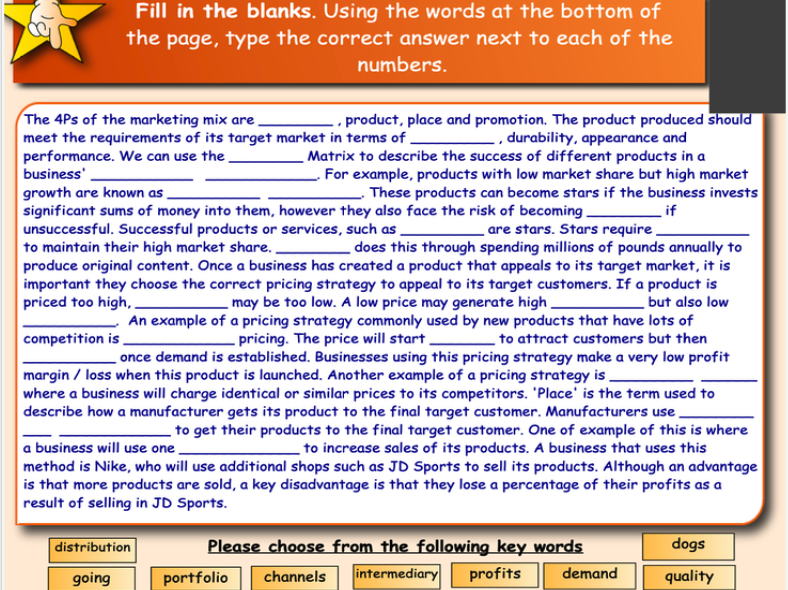
Marketing Mix RECAP STARTER
(0)
jonathanremmington1
Payback Period (PBP) Worksheet
(0)
jonathanremmington1
Indirect Taxation WORKSHEET
(0)
jonathanremmington1
Average Rate of Return
(0)
jonathanremmington1
Market Failure (Types of)
(0)
jonathanremmington1
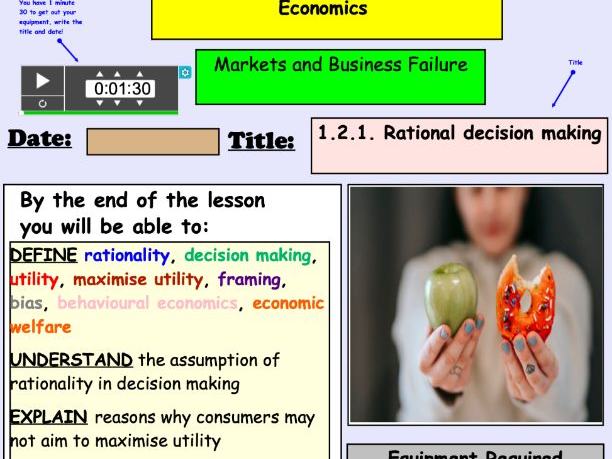
Rational Decision Making
(0)
jonathanremmington1
Business Location
(0)
jonathanremmington1
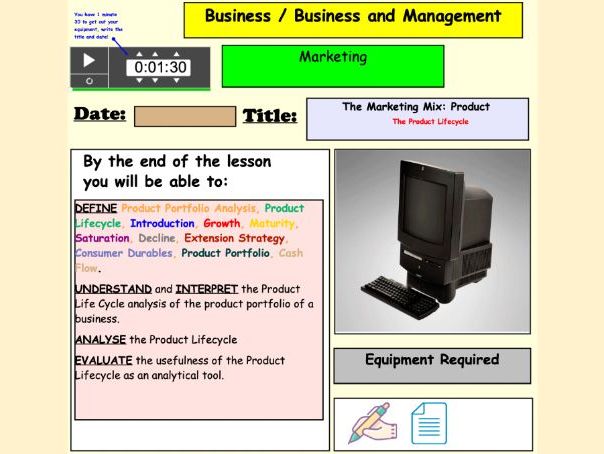
Product Lifecycle
(0)
jonathanremmington1
Market Share
(0)
jonathanremmington1
Free, Mixed and Command Economies
(0)
jonathanremmington1
Franchises / Franchising
(0)
jonathanremmington1
Advertising, Media and Peer Pressure
(1)
jonathanremmington1
Demand (SMART NOTEBOOK VERSION)
(0)
jonathanremmington1
Production Methods
(0)
jonathanremmington1
Positive Normative Worksheet and Teams Form Quiz
(0)
Previous
1
2
3
4
5
Next