Hello.
My methodology for lesson planning consists of three key concepts;
Simplicity for the teacher - I aim to plan lessons that are paper-resource light.
Clarity of understanding for the student - I aim to plan lessons that are clear in their sequencing.
Professional appearance - I aim to plan lessons that are designed for students rather than the board room.
I teach my lessons successfully and with enjoyment, but not every teacher is the same. I always appreciate constructive feedback :-)
LESSON COVERS:
Exploring what a super volcano is, how they are formed and how they are different to other volcanoes, and the potential extent of the effects of a super eruption (local vs. global)
LESSON INVOLVES:
Exploring the definition of a super volcano, using a video to introduce the concept and look at how they are formed. Developing map skills and data skills through comparing eruption size to regular eruptions. This task has a support graph for students to use. Using a video to introduce the idea of local and global effects, using notes taken from these videos to add information to maps of the world or North America - depending on ability.
RESOURCES:
Support graph template is available to complete or simply use as a guide for students to create their own. The two types of maps are in the same file on different slides - print as required.
NOTES:
The link the video is embedded, put the slides into slide show mode and then click on the video screen grab.
Please review with any feedback or if you spot any weevils in the lesson :-)
This bundle contains 8 lessons covering all aspects of the LIC City part of the new Urban Issues and Challenges unit for AQA GCSE Geography, including an introduction to Rio lesson, and a review lesson.
Lessons are fully resourced, include a number of GCSE practice questions and differentiation and challenge opportunities for most tasks.
Please review with any feedback.
LESSON COVERS
What longitude and latitude is and how it can be used to locate countries. The different characteristics of countries including biomes, temperature and other features.
LESSON SUMMARY
Lesson starts with a “quick maths” task where students are asked to come up with various numbers (no.of reindeer, continents etc) and add/subtract them to come up with an answer (closest wins as they rarely get it right, but have fun trying).
First main task introduces Longitude and Latitude using a very catchy video, and then gives students a chance to locate countries using these coordinates. The second main task asks students to use their list of countries to plot Santa’s trip and describe the places he visits using information maps (biomes, temperature and other features, as well as your own atlas if you wish).
The lesson is Christmassy themed throughout, with extension and differentiation, and there is a grid reference support task for those who are struggling with longitude and latitude.
LESSON RESOURCES
For the video click on the word “video when it is in slide show mode”. Students need to use the map template in conjunction with an atlas to work out which countries they land on (if you don’t have atlases you can print world maps from the internet). The information maps can be put up on the board if you’d rather not print in colour, equally you could ignore them altogether and use your own biome maps, or other information from your own atlases.
LESSON COVERS:
different elements of the Favela Barrio project and it is improving quality of life for favela residents.
LESSON INVOLVES:
the main task is a round-the-room differentiated info hunt activity, followed by a differentiated before-and-after annotation activity.
RESOURCES:
the info hunt posters should be put up around your room, or alternatively can be printed off as slide show handouts and used while students are sat at their desks. The before and after sheet has a differentiated version with sentences starters (see page 2).
Please review with any feedback :-)
LESSON COVERS:
the location of the dam, how a dam works, the advantages and disadvantages of the dam and how it may impacts people and the environment.
LESSON INVOLVES:
students first generate questions for themselves about the dam which they then come back to answer later. The dam is then located by slowly zooming in on google earth (students to identify when they can see it). There is a video to make notes from on how a dam works, then a video for students to collect advantages and disadvantages (each video is hyperlinked if you click on the screen grab once in slide show mode). Students then read people profiles and plot each person on a graph to show how they are effected by the dam (differentiated). The final task is to write a letter as the president to the dam designer arguing for or against the dam's construction in the first place.
RESOURCES
There is an extra information sheet for any students wanting ore information.
Please review with any feedback :-)
LESSON COVERS:
environmental problems relating to traffic and congestion, water pollution, air quality/pollution and waste collection.
LESSON INVOLVES:
handing out Rio resident roles and role playing favela residents forum where n they complain about environmental issues. There are cue cards for the residents with the specific issue in bold along with the details of how that issue relates to them. There are two cue cards per issue for 4 issues (so 8 in total). Students record the issues in a as they are listening table. The next tasks is differentiated on-board reading task where students find solutions to match the issues. End's with an exam practice question.
RESOURCES:
Rio residents complaint cards to be sliced out and handed out as you see fit (then intact copies can be used as help sheets for students to fill in gaps afterwards). The on-board solutions task slide can also be printed out seperately.
NOTES:
you can also choose a student to take the "minutes" of the meeting, type them up on a slide as the meeting takes place. Students can then use these notes as a reminder when filling in their tables afterwards.
LESSON COVERS:
Urbanisation, rates of urbanisation, push and pull factors, rural urban migration and natural increase. POSSIBLE DOUBLE LESSON
LESSON INVOLVES:
main features include key word activities exploring and applying the definition of HIC, LIC, NEE, Push and Pull factor. A timed activity where student have 90 seconds to view an image and decide if it is is a push or a pull factor and explain (it is slide 7 - once on the slide click to start the clock, it should go through each image automatically - you can remove the animations if you prefer). This is followed by an activity using the Brandt line map and a topological style map identifying urbanised countries. The last big activity is a categorising activity for rural-urban migration vs. natural change.
RESOURCES:
copies of the relevant text book pages, along with shading sheets for urbanisation causes, and gap fill support activity for the demonstrate task.
NOTES:
the construct activity slide for identifying push or pull factors is on an automatic timer. Open the animation pane on the slide to remove if you wish.
Please review with any feedback :-)
LESSON COVERS:
an introduction to Bristol's location, it's importance as a city, why it has become so big and what migration means for the city.
LESSON INVOLVES:
whole lesson creative activity - the creation of a welcome to Bristol mat, to be populated with differentiated info from the slides, and or/supporting photocopy.
RESOURCES:
welcome mat should be printed out on A3.
NOTES:
The info slides are on timers and will change every 13 minutes - this can be easily adjusted on the transition settings, or overridden manually. To access the youtube video put the powerpoint in slide show mode and click on the video screen grab.
Please review with any feedback :-)
LESSON COVERS:
DOUBLE LESSON...the cause and result of urban industrial decline and the consequent urban regeneration, as well as the causes of urban sprawl and the advantages and disadvantages of commuter settlements. Case studies used are Bradley Stoke (commuter settlement) and Bristol Harbourside (urban regeneration).
LESSON INVOLVES:
looking at key terms: housing demand, greenfield site, urban sprawl, regeneration, brownfield site. Link to a video to find positives and negatives for developing both greenfield and brownfield sites, with back up photocopy resource. A verbal domino task gives the back story for industrial decline of Bristol's harbourside. Students then create their own dominoes with Q&As on the regeneration of the harbourside and the commuter settlement, Bradley Stoke. Bradely Stoke is explored more with a statement match up task before finishing with an exam question.
RESOURCES:
There are dominoes templates of two different sizes for students who write in different levels of detail/size of handwriting. The case study sheets are saved separately as HIGHER files for more able students, and a DIFFERENTIATED version in simpler text.
NOTES:
probably a double lesson. Youtube video link can be accessed by clicking on the video screen grab while in slide show mode. Dominoes for industrial decline can be handed out and read out for the whol class to hear, or can be given out in pairs or groups.
Please review with any feedback :-)
LESSON COVERS:
strategies used in London to overcome congestion, including: the London Underground, the Emirates skyline, the buses and the Santander hire bikes.
LESSON INVOLVES:
starts with exploring some facts about congestion identifying the trend that congestion is increasing. A video highlighting congestion issues in London is a precursor to a task where student look at different congestion strategies, rating them on a diamond graph with 4 axis, explaining how they've rated them, and looking for a pattern that shows the most effective strategy. Lesson ends with an exam question.
RESOURCES:
The diamond graph can be drawn from scratch by higher ability students, but there is a ready made copy if support is required. The video is accessed by putting the powerpoint in slide show mode and clicking on the screen grab. The strategy sheets can be printed (double sided) on different colour paper to enable them to be more identified, equally they can be put up on the board for students to work through altogether. Text on the strategy cards is differentiated.
NOTES:
Blank boxes on slides 4 and 7 are for the teacher to type in ideas as students are contributing them.
Please review with any feedback :-)
LESSON COVERS:
looking at why some areas of the UK became heavily populated in the past, and why some areas are heavily populated now (looking at job availability, economic opportunities, culture, etc)
LESSON INVOLVES:
identifying key words (location, distribution and settlement), using clues about urban growth to identify major cities on a map. Students annotate and draw arrows onto a map to show how urban areas and populations are changing now, identifying influencing factors and making predictions, and looking for similarities between influencing factors in the past and now. Lesson ends with an exam question.
RESOURCES:
there are two maps with this lesson, the "Who am I maps" have the options for the clues on them, the "So now..." maps are for the annotation task. There is also a bonus clues sheet for those struggling with the Who am I task, as well as a partially complete table for those student who may need it.
NOTES:
the annotating map task will require prior knowledge of reasons why people migrate. If you haven't studied that in this unit yet you can teach or tweak the lesson accordingly.
Please review with any feedback :-)
LESSON COVERS:
three ways in which Bristol has taken the opportunity to overcome environmental challenges, including: reducing congestion by using the integrated transport system, providing more habitat and green space through urban greening, and saving resources through comprehensive recycling schemes.
LESSON INVOLVES:
students are told that Bristol is on a mission to become Europe's greenest city, and that there are three steps to achieving this mission: recycling, urban greening, and integrated transport. For each opportunity there is an activity, including a compound graph drawing activity for recycling. Lesson ends with an exam question.
RESOURCES:
the video is hyperlinked - put the powerpoint in slide show mode, and click on the screen grabbed image of the video. All other resources are attached here, but you will need graph paper for the graph.
NOTES:
this is potentially a DOUBLE LESSON
Please review with any feedback :-)
LESSON COVERS
How goats can be bought through Oxfam, Goat Aid operating countries, benefits of goats for reducing the development gap, as well as possible negatives.
LESSON SUMMARY
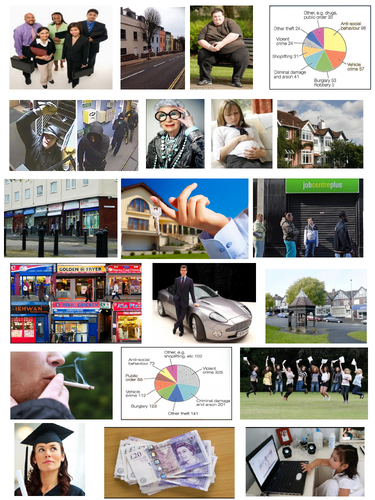
Students are initially presented with an image of a goat and asked for ideas on the advantages of goat ownership. This is followed by a 3 mark map-based exam question. Main concept is presented through 3 short videos. Students are then required to shade advantages and disadvantages of the scheme on a sheet with a challenge task for more able students to write the advantages and disadvantages from the sheet as paragraphs. Following this students then create a visual representation of the positive impacts, and knock-on positive impacts of goat ownership, with higher ability students asked to analyse the value of these benefits. Finally there is a 6 mark exam question.
LESSON RESOURCES
The videos are all hyperlinked into the word “video” which can be clicked on in slideshow mode. The “goat benefits tree” example document can be edited or used for scaffolding/for lower ability students. If you’d rather not print the shading sheet students can copy comments down into a table instead.
FULLY EDITABLE……
These packs, one for higher ability on one for middle ability, are fully editable to adapt to your topics, or specific case studies.
We give them to students as a one-stop-shop for everything we have taught them and as a point of reference to check revision guide content against.
Content can be easily edited but as they are they currently cover: UK Physical Landscapes, Natural Hazards, Living world (with cold environment), and Changing Economic World, Urban Issues and Challenges, Resource management (energy focus).
Each pack (which can be printed as a large booklet) contains:
space on the front page for students to record target exam tips
the exam question numbers
SPaG guidance
command words
exam tips (can be removed if they don’t fall in line with your own guidance)
mind map pages for each topic
topic break down sheets where each topic is broken down into smaller parts, with space for making revision notes, writing down key words or facts. (HA = higher ability as leaves space for notes, MA = middle ability and has prompt images in the note spaces, which can be deleted if preferred)
key word lists with space for definitions (HA includes more words than MA)
The pack can equally be broken down, key word lists, topic sheets can be copied and pasted out to be printed/edited separately.
LESSON COVERS
the major changes in the UKs economy including deindustrialisation, the post industrial economy and the move towards service industries, science and business parks.
LESSON INVOLES
the majority of the lesson is taken up by the creation of a timeline (differentiated by target)- first looking at what happened and when, then using different colours to explain why the things happened/are happening or will happen. The final task is to put these pieces together into a short story supported by mixed up sentences.
LESSON RESOURCES
the timeline activity is supported by some information sheets that are intrinsically differentiated (some info boxes are easier to read, some more complex).
The lesson also includes a 5 minute "Review Previous Learning" task, as a revision tool - feel free to omit or adapt.
Please review with any feedback or if you spot any weevils in the lesson :-)
LESSON COVERS
Improvements to the UK transport infrastructure including: HS2, motorway upgrades, Heathrow third runway, Liverpool port improvements. Going on to look the challenges this presents for sustainability and Torr Quarry as an example of sustainable economic development.
LESSON INVOLVES
Watching a series of videos and making differentiated targeted notes on the different improvements in transport identified above. Then an exam question to identify that the increase in economic development leads to increased emissions. After this students then create a differentiated mini infographic on Torr Quarry as an example or where development can be sustainable - taking into account social, environmental and economic impacts. Final task is an exam question. Peer assessment mini plenaries, starter and final plenary are also included.
LESSON RESOURCES
There are sheets for students to make their video notes on, as well as template for the mini infographic.
IMPORTANT - for the infographic task the lesson uses the Blue Oxford GCSE Geography AQA text book (edited by S. Ross). If you don’t use this text book the infogRaphic task can be adapted for whichever case study you choose to use.
The lesson also includes a 5 minute “Review Previous Learning” task, as a revision tool - feel free to omit or adapt.
Please review with any feedback or if you spot any weevils in the lesson :-)
LESSON COVERS:
discovering what sinkholes are, why they happen and the dangers they pose for humans
LESSON INVOLVES:
students form questions about a sinkhole photo to start the lesson - they then come back and answer these questions at the end. A video introduces the concept and then definition and key words are explored. A map is used to explore and describe where they occur. Another video then explains how they occur, students then explain in their own terms through annotated diagrams. To end there is a writing exercise where students imagine they are the brother of a man swallowed by a sink hole.
SKILLS:
-Map skills with direction and continent and country location.
-Diagram drawing and annotations
RESOURCES:
the lesson includes link to videos. If you put the lesson in slide show mode and click on the screen grab of the video it will take you to the video itself. Or you can click on the image and go to insert>hyperlink across the top and copy and paste the link out of the box.
NOTES:
most activities are differentiated and/or have challenge and support options
Please review with any feedback/improvements required :-)
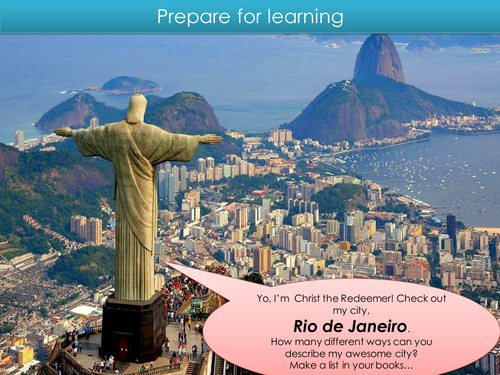
Welcome to Rio de Janerio!
LESSON COVERS:
the location, population and importance of an LEDC/HIC city on different scales.
LESSON INVOLVES:
students creating an A3 Welcome to Rio information sheet. The sheet will have 4 sections with a differentiated info slide for each section. Slides are timed to create pace, but this can be manually overridden.
RESOURCES:
are included and their use is indicated on the slides. The video link is embedded in the video screen shot (just play the slide show then click on the screen shot, it will take you to the video). You will need to tweak the Atlas page number depending on your atlas brand.
NOTE:
The keys indicate key words
LESSON COVERS:
Favela Barrio's adult education classes, new health care centres and addiction help services, pacification, positives and negatives of drug gang rule, informal jobs, scarcity of jobs.
LESSON INVOLVES:
students think about the life of a 12 year old in the favela and what life options he has available to him. They make life decisions at age 12 and 20 for a boy called Adeo and detail their choices for him on a Life Decision sheet. The information they need to inform these decisions and complete their sheets is on the slides.
RESOURCES:
The Life Decision sheet is usually printed A3, their is also a differentiated version with sentence starters.
NOTES: the information slides can be printed, I just always try to plan my lessons as paper free as possible. And TMT means "This means that...."