Hero image

A_Gualda's Shop

Average Rating3.72
(based on 27 reviews)

Planned and tested Mathematic resources for teachers in the primary, secondary and FE sectors. A wide range of subject matters from algebra to geometry in both interactive and powerpoint formats. So if you need an affordable solution for a Maths lesson plan then the Maths Geezer has a solution.

239Uploads

69k+Views

14k+Downloads

Planned and tested Mathematic resources for teachers in the primary, secondary and FE sectors. A wide range of subject matters from algebra to geometry in both interactive and powerpoint formats. So if you need an affordable solution for a Maths lesson plan then the Maths Geezer has a solution.
Probability Two Way Tables (ppt)
A_GualdaA_Gualda

Probability Two Way Tables (ppt)

(0)
Lesson objectives: To be able to interpret data from a two-way table. To be able to work out probabilities from a two-way table. Includes; worked examples, practise questions, exam questions and worksheets.
Simple Probability (ppt)
A_GualdaA_Gualda

Simple Probability (ppt)

(1)
2/3 lessons. Objectives: To understand probability words. To know the probability of an event happening lies between 0 and 1. To place events on a probability line. To be able to workout the probability of an event. Includes: Teachers notes; Lesson starters; Worked examples; Practise questions; Plenary questions.
Solving Quadratic Inequalities (ppt)
A_GualdaA_Gualda

Solving Quadratic Inequalities (ppt)

(0)
3/4 lessons, includes step by step guide, worked examples, practice questions with solutions, and worksheets. The big idea is to solve the inequalities to find the critical values, the to test a point on a number line to determine the correct inequality. Objectives: To be able to solve quadratic inequalities algebraically. The lessons are split into 3 sections: A recap of solving linear inequalities. Solving simple quadratic inequalities. Solving harder quadratic inequalities that involve rearranging and factorising to find the critical values.
Negative and Fractional Powers (pptx)
A_GualdaA_Gualda

Negative and Fractional Powers (pptx)

(0)
2 lessons, includes step by step guide, worked examples, practice questions and exam style questions. Objectives: To understand and use negative powers. (grade 5) Find the value of problems involving positive, negative and fractional indices, with a calculator. (grade 6) Find the value of problems involving positive, negative and fractional indices, without a calculator. (grade 7)
Substitution into Formulae. (pptx)
A_GualdaA_Gualda

Substitution into Formulae. (pptx)

(0)
2-3 lessons, includes step by step guide, worked examples and practice questions. Objectives: Evaluate simple formulae by substituting numerical values. Evaluate formulae with powers and roots by substituting numerical values.
Exact Trig Ratios (ppt)
A_GualdaA_Gualda

Exact Trig Ratios (ppt)

(0)
Lesson Objectives: Know and use the exact values of sin and cos for 0, 30, 45, 60, 90. Know and use the exact values of tan for 0, 30, 45, 60. Includes, calculator practise, trig recap (SOHCAHTOA), finding exact trig ratios from first principles, list of values to learn, memory aid table, non-calculator questions.
Number Bonds to 20 (notebook)
A_GualdaA_Gualda

Number Bonds to 20 (notebook)

(0)
Year1 Number - Addition and Subtraction lesson on Number Bonds to 20. Split into three parts. Part 1: Recap and extension. Part 2: Reading, writing and interpreting mathematical statements. Part 3: Using knowledge of number bonds to 20 to solve problems with larger numbers. Lesson Objectives: a) To read, write and interpret mathematical statements involving addition (+) subtraction (-) and equals (=) signs. (1C2b) b) To be able to represent and use number bonds and related subtraction facts within 20. (1C1) c) To be able to add and subtract single-digit and two-digit numbers to 20, including zero. (1C2a) d) To solve one step problems that involve addition and subtraction. (1C4) Students are encouraged to use a range of concrete objects to help them solve problems. Includes recording templates for diagrams, words and symbols, using a Ten Frame, and Mastery questions, and blank templates/worksheets. This interactive allows students to partition biscuits into two plates to make different combinations of number bonds.
Histograms (notebook)
A_GualdaA_Gualda

Histograms (notebook)

(0)
3-4 lessons, divided into four distinct parts: Using frequency density and bar widths to find group frequencies. Drawing histograms with unequal bar widths. Interpreting histograms with unequal bar widths. Estimate values from an histogram. Each part includes a step by step guide, worked examples, practice questions with solutions, and student worksheets. This interactive version includes Teachers’ Notes, moveable objects including bars.
GCSE Algebra Revision (ppt)
A_GualdaA_Gualda

GCSE Algebra Revision (ppt)

(0)
Two lessons, including worked examples and practise questions. Topics: 1. Solving Equations 2. Substitution into Expressions 3. Simplifying Expressions 4. Expanding Brackets 5. Factorising Expressions
Stem and Leaf Diagrams (pptx)
A_GualdaA_Gualda

Stem and Leaf Diagrams (pptx)

(0)
2 lessons, includes step by step guide, worked examples and practice questions with solutions. Objectives: To be able to represent data in an ordered stem & leaf diagram 2, To be able to find the mode, median and range from an ordered stem and leaf diagram (including Back to Back Steam and Leaf, and comparing two sets of data).
Relative Frequency (pptx)
A_GualdaA_Gualda

Relative Frequency (pptx)

(0)
2 lessons, includes step by step guide, worked examples, practice questions and worksheets. Starter activity - “How many reds?” an experiment in predicting. Object being that students understand that more trials, means the relative frequency is closer to theoretical probability Objectives: Estimate probabilities on experimental data. Use relative frequency as an estimate of probability.
Trigonometry (pptx)
A_GualdaA_Gualda

Trigonometry (pptx)

(0)
3 lessons, taking students through a step by step process of what is a trig ratio, to how to what buttons to use on a calculator, to problem solving. Includes; keywords, why we use trig, correct labeling of sides, using SOH/CAH/TOA and related formulae. Plus worked examples, practice questions, exam style questions, and a separate lesson on Angles of Elevation and Depression. Objectives: To be able to use a calculator to find trigonometric ratios. (grade 5) To be able to recognise which trigonometric ratios to use. (grade 5) To be able to use trigonometric ratios to solve problems. (grade 5/6)
Histograms (pptx)
A_GualdaA_Gualda

Histograms (pptx)

(0)
3-4 lessons, divided into four distinct parts: Using frequency density and bar widths to find group frequencies. Drawing histograms with unequal bar widths. Interpreting histograms with unequal bar widths. Estimate values from an histogram. Each part includes a step by step guide, worked examples, practice questions with solutions, and student worksheets.
Roots and Turning Points of Quadratic Graphs (pptx)
A_GualdaA_Gualda

Roots and Turning Points of Quadratic Graphs (pptx)

(0)
Higher level GCSE Algebra. Using the Quadratic Formula. The presentation shows graphically what the Roots and Turning points of Quadratic Graphs are. Then takes students through an example of solving a quadratic using the formula and relate it to the graph. Finally substituting to find the turning point.
Compound Measures (pptx)
A_GualdaA_Gualda

Compound Measures (pptx)

(0)
2-3 lessons, includes step by step guide, worked examples and practice questions. Objectives: To be able to solve problems involving compound measures including: Speed, Distance and Time. Density, Volume and Mass. Pressure, Force and Area. Population Density, Population and Area
Simplifying and Rationalising Surds (ppt)
A_GualdaA_Gualda

Simplifying and Rationalising Surds (ppt)

(0)
Lesson objectives: To understand the definition of a surd. To be able to simplify surds. To be able to rationalise simple fractions with a surd in the denominator. Includes worked examples, practise questions, and exam questions.
Solving Inequalities Graphically (ppt)
A_GualdaA_Gualda

Solving Inequalities Graphically (ppt)

(0)
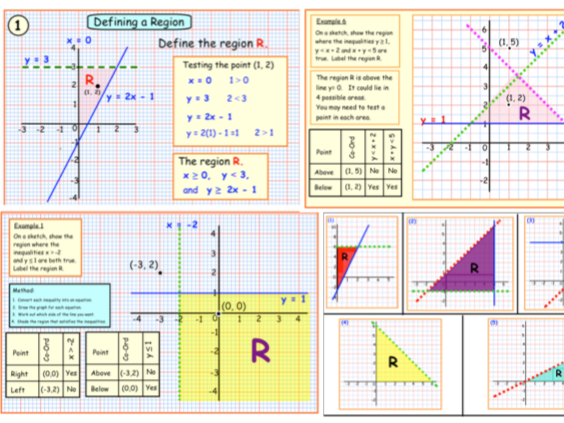
3/4 lessons, includes step by step guide, worked examples, practice questions with solutions, and worksheets… Objectives: To be able to show inequalities on a graph. The lessons are split into 3 parts: A recap of equations of straight lines, and drawing straight lines Being able to understand, and define a region bounded by inequalities. Drawing lines to find a region.
Probability Experiments and Games
A_GualdaA_Gualda

Probability Experiments and Games

(2)
Five different probability experiments and games that can be used as the start of a lesson, to collect data to allow comparisons between realative frequency and theorectical probability. I have used these activities in both secondary schools and FE colleges. They really do work in engaging students of all abilities. All can be used as stand alone fun activity, at the end of a working week as a treet. The probability bingo is a real winner. The pack features: Lucky Maze Game Me Tarzan, You Jane Probability Bingo Probability Horse Racing Game Predict the colours in the bag. Full instructions and suggestions included.
3 Line Victory Game
A_GualdaA_Gualda

3 Line Victory Game

(0)
A game of strategy and logic for all ages. Simple to play, harder to master. Gets a 5 Star rating from my students. Great Fun to play. Full instructions included.
Probability Card Sort
A_GualdaA_Gualda

Probability Card Sort

(0)
Students are given a number of different events, which they will then discuss the likelihood of them happening, and place in the groups headed: Impossible, unlikely, evens, likely, certain.