


Recent
Most read

In their lifetime, children who grow up in poverty are far more likely to experience poorer health, lower earnings, a shorter life expectancy and lower levels of happiness than their peers.
It’s a shocking statement but one that numerous reports have made clear is a daily reality for many children and young people in the UK.
As such we know that investing in early childhood can improve outcomes for our poorest children. However, progress to narrow the gap between them and their more affluent peers has stalled.
Given this, it is hard not to be pessimistic about our ability to tackle these deep-rooted inequalities. Falling living standards, public service funding cuts and workforce shortages mean trends are once again worsening.
Indeed, when you look at Early Years Foundation Stage Profile (EYFSP) scores across different places, you see a clear correlation between average scores for children and area-based deprivation. The poorest local authorities tend to have the lowest levels of school readiness.
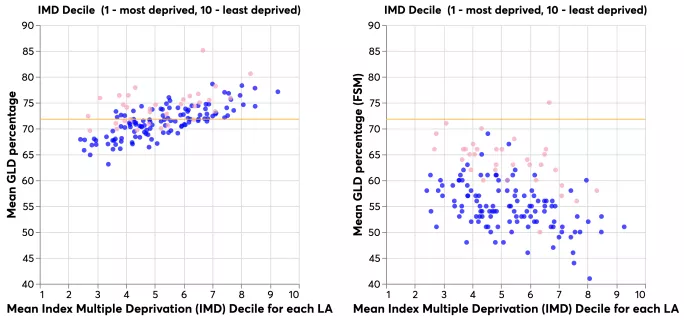
Figure 1. Pink dots are London boroughs; blue dots are all other LAs in England; the yellow line is the England average for the percentage of children reaching a good level of development
It looks bleak - but there are signs of hope hiding in the data.
In our report, published today, we show that even in areas of high deprivation, it is possible for children on free school meals to reach a good level of development relating to their communication and language; personal, social and emotional development; physical development; literacy; and maths.
To do this, we used data science methods to cluster local authorities (LAs) into groups of similar areas, using 190 variables that include a varied range of factors including demographics, health outcomes, access to services and air quality. By combining numerous datasets and comparing them with the EYFSP scores, we have been able to create the first grouping of LAs that takes into account the factors that may affect the environment in which a child grows up.
It enables us to compare like with like, rather than comparing an inner city borough with high connectivity and easy access to public transport to an authority with a dispersed population and buses that run only every hour.
The findings are striking.
They show that children in some areas stand a better chance of reaching that level than they might in other authorities with similar geography, deprivation and demographics - often with clear variations within regions or even between neighbouring LAs.
For example, London boroughs that sit side by side and share similar populations have very different outcomes. It’s a similarly mixed picture in the Greater Manchester Combined Authority.
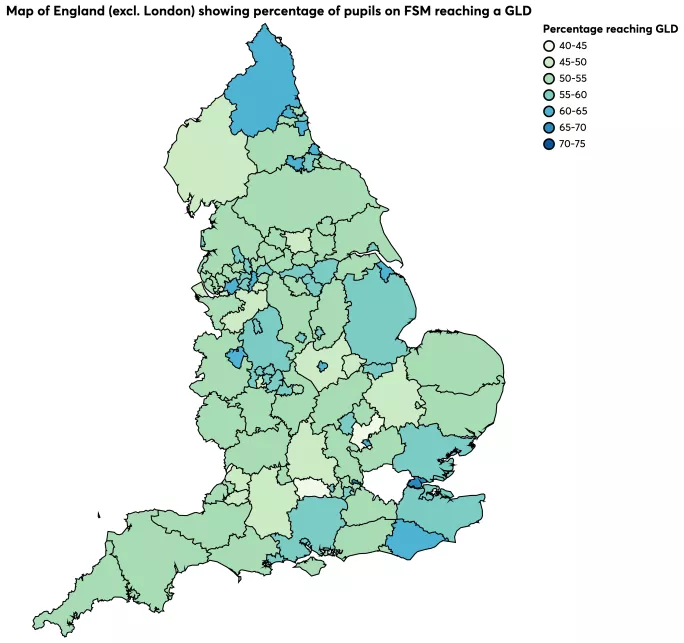
Figure 2. Map of England (excluding London) showing the percentage of children on free school meals reaching a good level of development (EYFSP data for 2019 from the Department for Education’s education statistics catalogue)
For instance, some areas have almost closed the gap between levels of school readiness of those on FSM and the average. In Hackney, 69 per cent of children on free school meals reached a good level of development in 2019 - only 1 percentage point less than children not on free school meals.
In neighbouring Newham, 71 per cent of children claiming free school meals reached a good level of development - only 1 percentage point less than the national average for all children.
Outside London, Slough has the next-smallest gap between children on free school meals and the national average at just under 3 per cent.
In Nesta’s clustering, it is grouped with Hackney and Newham, so is there something that these three LAs are doing that similar authorities could learn from? This question is at the heart of our work.
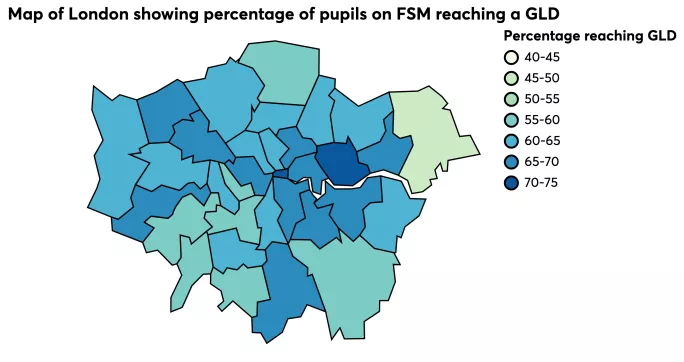
Figure 3. Map of London showing the percentage of children on free school meals reaching a good level of development (EYFSP data for 2019 from the Department for Education’s education statistics catalogue)
We also found some surprises in the data. On average, children on free school meals in more affluent areas actually have poorer results than those on free school meals in more deprived areas.
We’re not sure yet why this is happening. It’s possible smaller groups of poor children in affluent places get less time and attention.
Similarly, early years settings in wealthier areas may have less expertise in dealing with disadvantage - and the funding formula may be providing more money for public services in deprived areas.
It might also be partly explained by the judgements of teachers who complete the Early Years Foundation Stage Profile.
The truth is we don’t yet know.
But our findings present the tantalising possibility that if we can identify policies and services within those local authorities where disadvantaged children have a better chance of being “on track” when they start school, we can level the playing field by sharing that good practice with other areas so that they too can close the gap.
At a national level, this would mean that nearly 14,000 more children eligible for free school meals would move to a good level of development at age 5.
Our analysis has inspired a major research project. Nesta is now piloting an England-wide survey of all local authorities to generate a clearer picture of the services and support they offer children and their families before they start school.
In the coming months, we’d like to talk to all English local authorities to build up a picture of early years services so we can start to piece together some plausible explanations for the variations in outcomes.
Our goal is that we can use this data to support local authorities with learning and improvement.
We’ll work with them to find promising ideas and practices to build on, test more rigorously and help share across the sector. By working in partnership with local areas, we hope to help identify and elevate what already works.
Of course, data can never tell the whole story and should only be used in context. It’s not necessarily helpful to draw too strong conclusions from data and use them as tools to make judgements about individual performance.
This work represents a different approach - using data to do what it can do very powerfully: providing clues for us all to use to help us to learn and improve.
We hope that by working in partnership with local areas to identify and elevate what works, we can get closer to a future where every child can achieve their full potential regardless of the circumstances they’re born into.
Rachel Wilcock is a data scientist in Nesta’s Fairer Start team. Louise Bazalgette is deputy director of the Fairer Start team